2026/05/21(木)GrafanaでLokiのログからログメッセージを部分一致で検索する

投稿日:

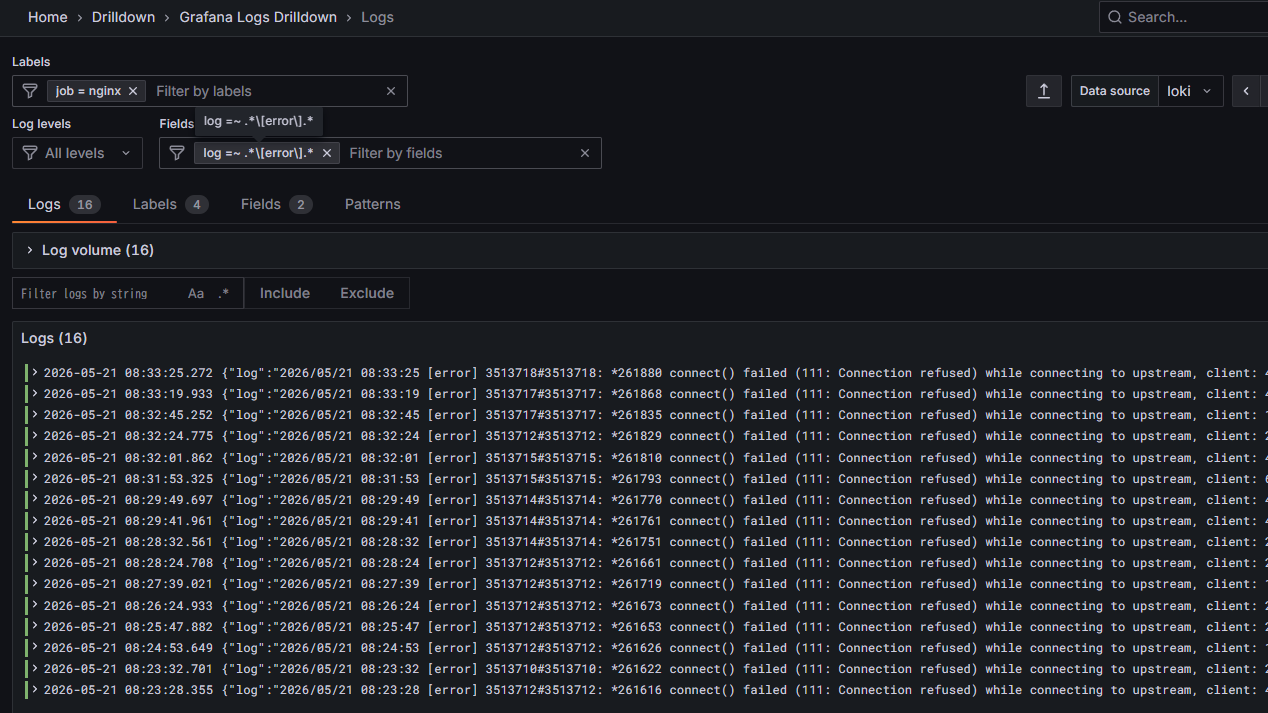
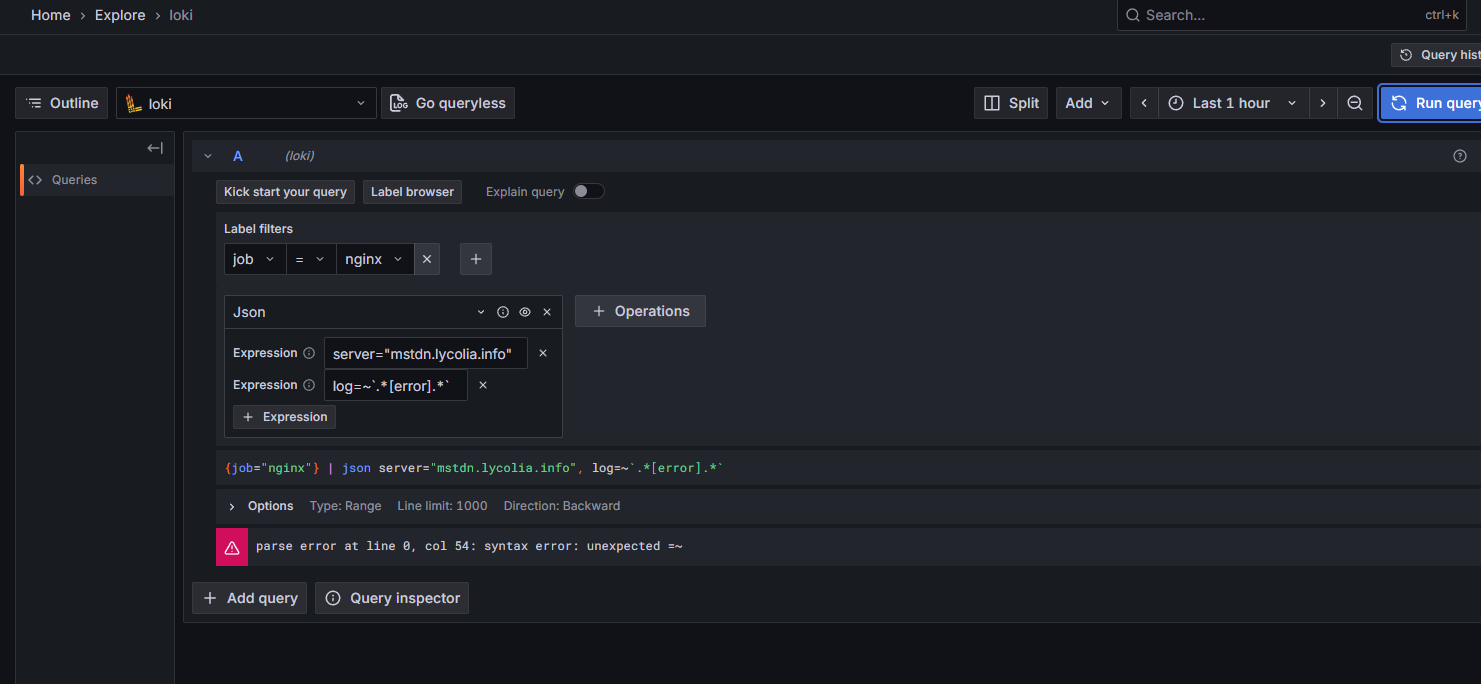
Grafana Logs Drilldownではフィルタ出来るのにExplore > Lokiでクエリを打ってもログを引けなかった。これを引けるようにするのが目的。

確認環境

nginxのログをFluentBitで拾いLokiに送る構成。

Env Ver
Ubuntu 24.04.3 LTS
Loki 3.5.9
FluentBit 4.2.2
nginx 1.26.1
Grafana v12.1.1

やり方

server: mstdn.lycolia.info[error]を含むものを検索する場合、こうしておくと引ける。要点はjson msg="log"で別名をつけること。logのままでは構文エラーになる。

{job="nginx"} |= `error` |= `server: mstdn.lycolia.info` | json msg="log" | msg=~`.*\[error\].*`

|= errorについてはQuery best practices | Grafana Loki documentationで、最初にラインフィルタをかけるとパフォーマンスが上がるということで付けている。

server="mstdn.lycolia.info"を指定するとなぜかうまくいかなかった。

2026/05/11(月)Mastodon周りのメトリクス収集メモ

更新日:
投稿日:

確認環境

Env ver
nginx 1.26.1
Apache2 2.4.58
PostgreSQL 16.13
Redis 7.0.15
Mastodon 4.5.9
Prometheus 3.5.0

Apache2

# 取得
wget https://github.com/Lusitaniae/apache_exporter/releases/download/v1.0.12/apache_exporter-1.0.12.linux-amd64.tar.gz
tar xvfz apache_exporter-1.0.12.linux-amd64.tar.gz

# binを配置
sudo cp apache_exporter-1.0.12.linux-amd64/apache_exporter /usr/local/bin/
ls -la /usr/local/bin/ | grep apache_exporter

# デーモン作成
cat <<'EOF' | sudo tee /etc/systemd/system/apache_exporter.service
[Unit]
Description=Prometheus Apache Exporter
After=network.target

[Service]
Type=simple
User=prometheus
Group=prometheus
WorkingDirectory=/var/lib/prometheus
ExecStart=/usr/local/bin/apache_exporter --scrape_uri=http://[::]:ここにポート番号/server-status?auto
Restart=on-failure
RestartSec=5

[Install]
WantedBy=multi-user.target
EOF

# デーモンの有効化
sudo systemctl daemon-reload
sudo systemctl enable --now apache_exporter

# 起動確認
curl "http://[::1]:9117/metrics"

# 掃除
rm -Rf apache_exporter-1.0.12.linux-amd64 apache_exporter-1.0.12.linux-amd64.tar.gz

PostgreSQL

# 取得
wget https://github.com/prometheus-community/postgres_exporter/releases/download/v0.19.1/postgres_exporter-0.19.1.linux-amd64.tar.gz
tar xvfz postgres_exporter-0.19.1.linux-amd64.tar.gz

# binを配置
sudo cp postgres_exporter-0.19.1.linux-amd64/postgres_exporter /usr/local/bin/
ls -la /usr/local/bin/ | grep postgres_exporter

# 監視ユーザーの作成
sudo -u postgres psql
CREATE USER postgres_exporter WITH PASSWORD 'ここにパスワード';
ALTER USER postgres_exporter SET SEARCH_PATH TO postgres_exporter,pg_catalog;
GRANT pg_monitor TO postgres_exporter;
quit

# 監視情報の作成
echo 'DATA_SOURCE_NAME="postgresql://postgres_exporter:ここにパスワード@localhost:5432/postgres?sslmode=disable"' | sudo tee /etc/default/postgres_exporter
sudo chown root:root /etc/default/postgres_exporter
sudo chmod 600 /etc/default/postgres_exporter

# デーモン作成
cat <<'EOF' | sudo tee /etc/systemd/system/postgres_exporter.service
[Unit]
Description=Prometheus PostgreSQL Exporter
After=network.target postgresql.service
Wants=postgresql.service

[Service]
Type=simple
User=prometheus
Group=prometheus
WorkingDirectory=/var/lib/prometheus
EnvironmentFile=/etc/default/postgres_exporter
ExecStart=/usr/local/bin/postgres_exporter \
    --web.listen-address=[::]:9187
Restart=on-failure
RestartSec=5
EOF

# デーモンの有効化
sudo systemctl daemon-reload
sudo systemctl enable --now postgres_exporter

# 起動確認
curl "http://[::1]:9187/metrics"

# 掃除
rm -Rf postgres_exporter-0.19.1.linux-amd64 postgres_exporter-0.19.1.linux-amd64.tar.gz

Redis

# 取得
wget https://github.com/oliver006/redis_exporter/releases/download/v1.82.0/redis_exporter-v1.82.0.linux-amd64.tar.gz
tar xvfz redis_exporter-v1.82.0.linux-amd64.tar.gz

# binを配置
sudo cp redis_exporter-v1.82.0.linux-amd64/redis_exporter /usr/local/bin/
ls -la /usr/local/bin/ | grep redis_exporter

# デーモン作成
cat <<'EOF' | sudo tee /etc/systemd/system/redis_exporter.service
[Unit]
Description=Prometheus Redis Exporter
After=network.target

[Service]
Type=simple
User=prometheus
Group=prometheus
WorkingDirectory=/var/lib/prometheus
ExecStart=/usr/local/bin/redis_exporter --redis.addr=redis://localhost:6379
Restart=on-failure
RestartSec=5

[Install]
WantedBy=multi-user.target
EOF

# デーモンの有効化
sudo systemctl daemon-reload
sudo systemctl enable --now redis_exporter

# 起動確認
curl "http://[::1]:9121/metrics"

# 掃除
rm -Rf redis_exporter-v1.82.0.linux-amd64 redis_exporter-v1.82.0.linux-amd64.tar.gz

Mastodonの組み込みExporter

  1. .env.productionに以下を追加
    MASTODON_PROMETHEUS_EXPORTER_ENABLED=true
    MASTODON_PROMETHEUS_EXPORTER_SIDEKIQ_DETAILED_METRICS=true
    
  2. デーモンを作る

    cat <<'EOF' | sudo tee /etc/systemd/system/mastodon-prometheus-exporter.service
    [Unit]
    Description=mastodon-prometheus-exporter
    After=network.target
    
    [Service]
    Type=simple
    User=mastodon
    WorkingDirectory=/home/mastodon/live
    Environment="RAILS_ENV=production"
    ExecStart=/home/mastodon/.rbenv/shims/bundle exec prometheus_exporter -b "::" -p 9394
    Restart=always
    
    [Install]
    WantedBy=multi-user.target
    EOF
    
    # デーモンの有効化
    sudo systemctl daemon-reload
    sudo systemctl enable --now mastodon-prometheus-exporter
    
  3. 起動確認
    curl "http://[::1]:9394/metrics"
    # Streamingはv4でしかlistenしてないので[::1]は諦める
    curl "http://localhost:5001/metrics"
    

2026/05/11(月)自宅サーバーに雑に監視を入れた時にやったこと

更新日:
投稿日:

Ubuntuのネイティブ環境にPrometheusとGrafanaをIPv6スタックで導入したの続き。

ちまちまやってて記憶が飛びまくってるので抜け漏れがあるかもしれないが、吐き出しておかないと記憶が散逸するので、一度書き留めておく。

やったこと

LokiとFluentBitを入れてnginxのログをGrafanaで見れるようにする。

環境セットアップ

ここでは例示のためにLokiのlistenポートは9100とする。

Loki

確認環境
Env Ver
Ubuntu 24.04.3 LTS
Loki 3.5.9
インストール
  1. リリース一覧からLokiのバイナリを探す。CLIとかではなく、Loki単品を探す
  2. インストールコマンドを流す
    wget https://github.com/grafana/loki/releases/download/v3.5.9/loki_3.5.9_amd64.deb
    sudo dpkg -i loki_3.5.9_amd64.deb
    rm loki_3.5.9_amd64.deb
    
  3. 後述する設定を行う
  4. サービスの起動と確認をする
    sudo systemctl start loki
    systemctl status loki
    
設定

/etc/loki/config.ymlを開き、IPv6でListenし、ポート番号が9100となるようにする。中身はデフォルトの設定の改編。

auth_enabled: false

server:
  http_listen_port: 9100

common:
  ring:
    instance_addr: "::"
    kvstore:
      store: inmemory
  replication_factor: 1
  path_prefix: /tmp/loki

schema_config:
  configs:
  - from: 2020-05-15
    store: tsdb
    object_store: filesystem
    schema: v13
    index:
      prefix: index_
      period: 24h

storage_config:
  filesystem:
    directory: /tmp/loki/chunks
参考

FluentBit

確認環境
Env Ver
Ubuntu 24.04.3 LTS
FluentBit 4.2.2
インストール
  1. インストールコマンドを流す
    # FluentBitのGPGキーをキーリングに追加
    sudo sh -c 'curl https://packages.fluentbit.io/fluentbit.key | gpg --dearmor > /usr/share/keyrings/fluentbit-keyring.gpg'
    # OSコードの取得
    codename=$(grep -oP '(?<=VERSION_CODENAME=).*' /etc/os-release 2>/dev/null || lsb_release -cs 2>/dev/null)
    # OSコードをもとにAPTリストへ追加
    echo "deb [signed-by=/usr/share/keyrings/fluentbit-keyring.gpg] https://packages.fluentbit.io/ubuntu/$codename $codename main" | sudo tee /etc/apt/sources.list.d/fluent-bit.list
    # パッケージリストの更新
    sudo apt update
    # Fluent Bitのインストール
    sudo apt install fluent-bit
    
  2. 後述する設定を行う
  3. DB配置場所を作成し、サービスの起動と確認をする
    # DB配置場所の作成
    /var/lib/fluent-bit/
    # デーモンの開始
    sudo systemctl start fluent-bit
    # デーモンの起動確認
    systemctl status fluent-bit
    
設定

/etc/fluent-bit/fluent-bit.confを開きファイル末尾に以下を足す。

# nginx access log
[INPUT]
    name              tail
    path              /var/log/nginx/access.log
    parser            json
    tag               nginx.access
    db                /var/lib/fluent-bit/nginx-access.db
    refresh_interval  5

# nginx error log
[INPUT]
    name              tail
    path              /var/log/nginx/error.log
    tag               nginx.error
    db                /var/lib/fluent-bit/nginx-error.db
    refresh_interval  5

# Loki へ出力
[OUTPUT]
    name        loki
    match       nginx.*
    host        ::1
    port        9100
    labels      job=nginx, log_type=$TAG[1]
設定解説

今回の設定についての説明であって汎用性は考慮していない。

  • [INPUT], [OUTPUT]
    • 入力か出力か
  • name
  • path
    • 入力ファイルのパス
  • tag
    • 出力で引っ掛けるときの名前
  • db
    • ログファイルをどこまで読んだかを記録する
  • match
    • ここにマッチしたtagが出力対象になる
  • host
    • Lokiのホスト
  • port
    • Lokiのポート
  • labels
    • Grafanaで引っ掛けるときのラベル

nginx

確認環境
Env Ver
Ubuntu 24.04.3 LTS
nginx 1.26.1
設定

nginxの標準ログでは得られるものが少ないので色々見れるようにする。ついでにjson形式にする。

  1. /etc/nginx/nginx.confを開きログ設定を以下のようにする

        log_format main_json escape=json
        '{'
            '"time":"$time_iso8601",'
            '"remote_addr":"$remote_addr",'
            '"remote_port":"$remote_port",'
            '"request_id":"$request_id",'
            '"scheme":"$scheme",'
            '"server_name":"$server_name",'
            '"server_port":"$server_port",'
            '"request_method":"$request_method",'
            '"request_uri":"$request_uri",'
            '"server_protocol":"$server_protocol",'
            '"status":$status,'
            '"body_bytes_sent":$body_bytes_sent,'
            '"bytes_sent":$bytes_sent,'
            '"request_length":$request_length,'
            '"request_time":$request_time,'
            '"http_referer":"$http_referer",'
            '"http_user_agent":"$http_user_agent",'
            '"ssl_protocol":"$ssl_protocol",'
            '"ssl_cipher":"$ssl_cipher",'
            '"connection":"$connection",'
            '"connection_requests":"$connection_requests"'
        '}';
    
        access_log  /var/log/nginx/access.log  main_json;
    
  2. nginxを再起動する
    sudo systemctl restart nginx
    

Grafana

確認環境
Env Ver
Ubuntu 24.04.3 LTS
Grafana v12.1.1
  1. Grafanaのダッシュボードを開く
  2. 左のグローバルナビからConnections→Add new connectionでLokiを追加する
  3. URLをhttp://[::]:9100で指定する
  4. Explorerを開きLokiを選び「Go queryless」を押すとLokiの中身が見れる

2025/11/12(水)R86S U1を冷やそうとした作業の残渣

R86S U1のファンはいかにも貧弱でいつ壊れても不思議がなかったので、壊れる前にもうちょいマシにしようと試行錯誤したログ。

やろうとしたこと

既存のケースを外し、ラズパイ用の大型クーラーをつけて適当なケースを作って冷やせるようにしようとした。

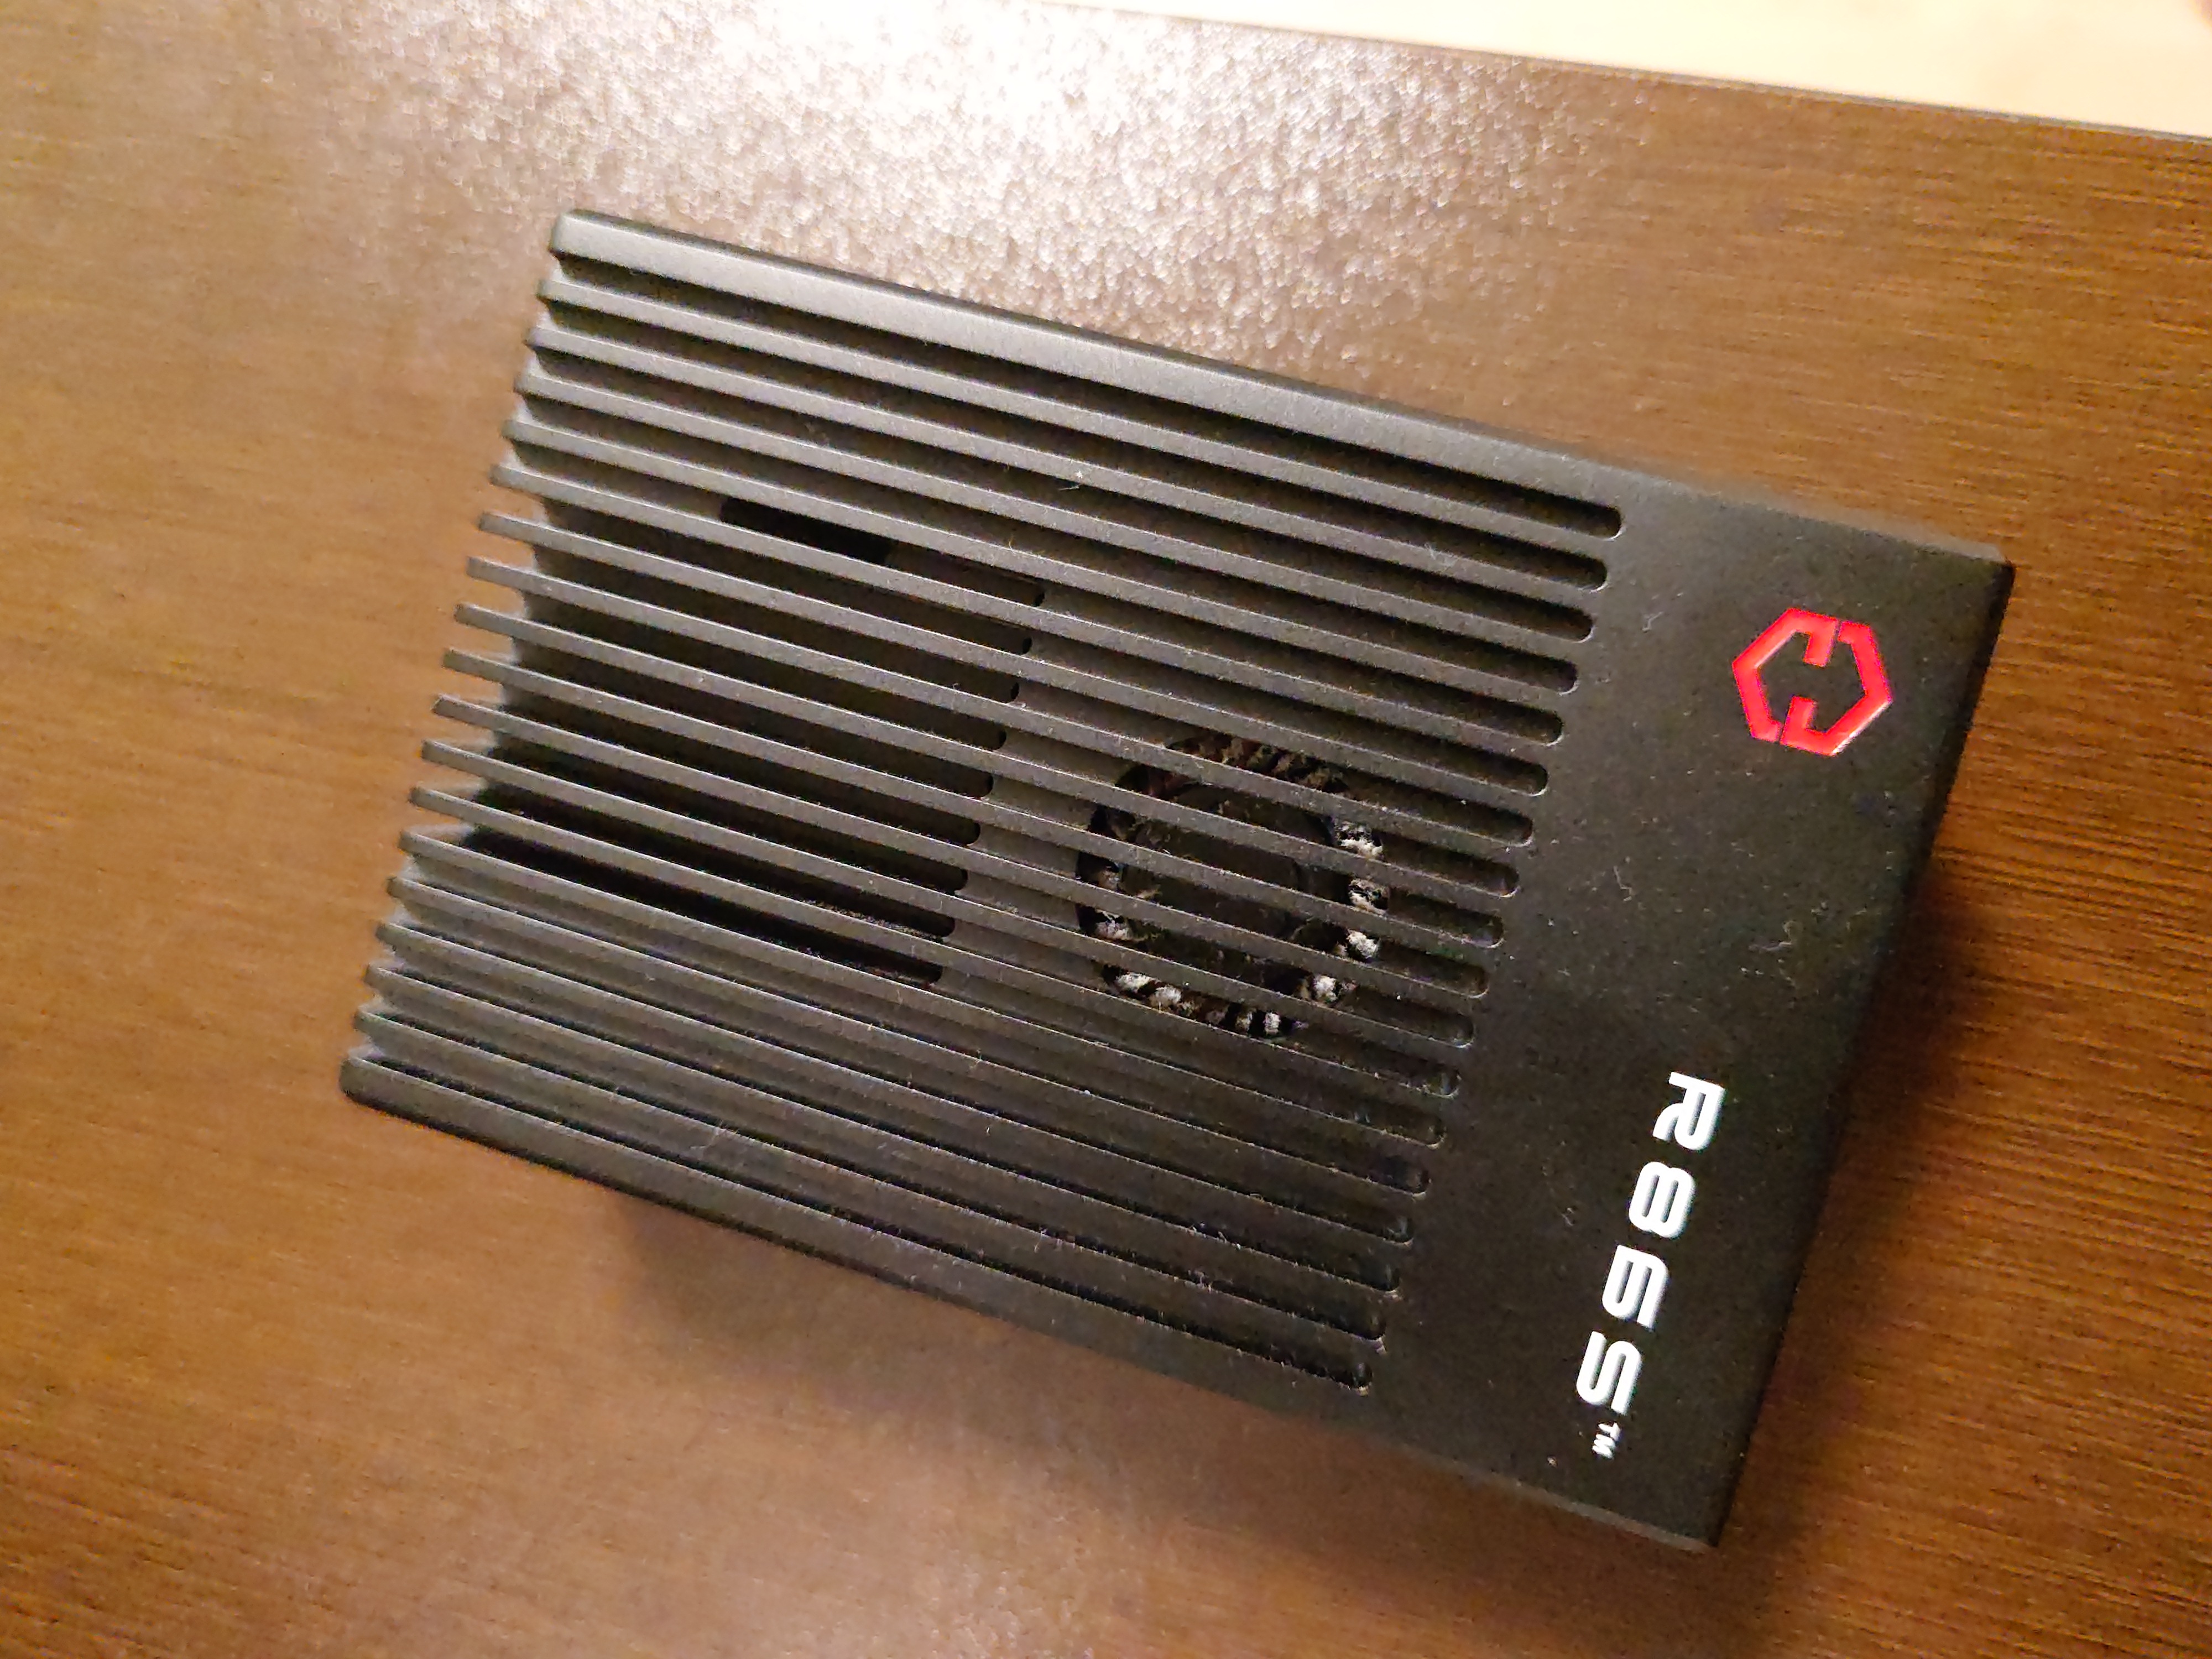
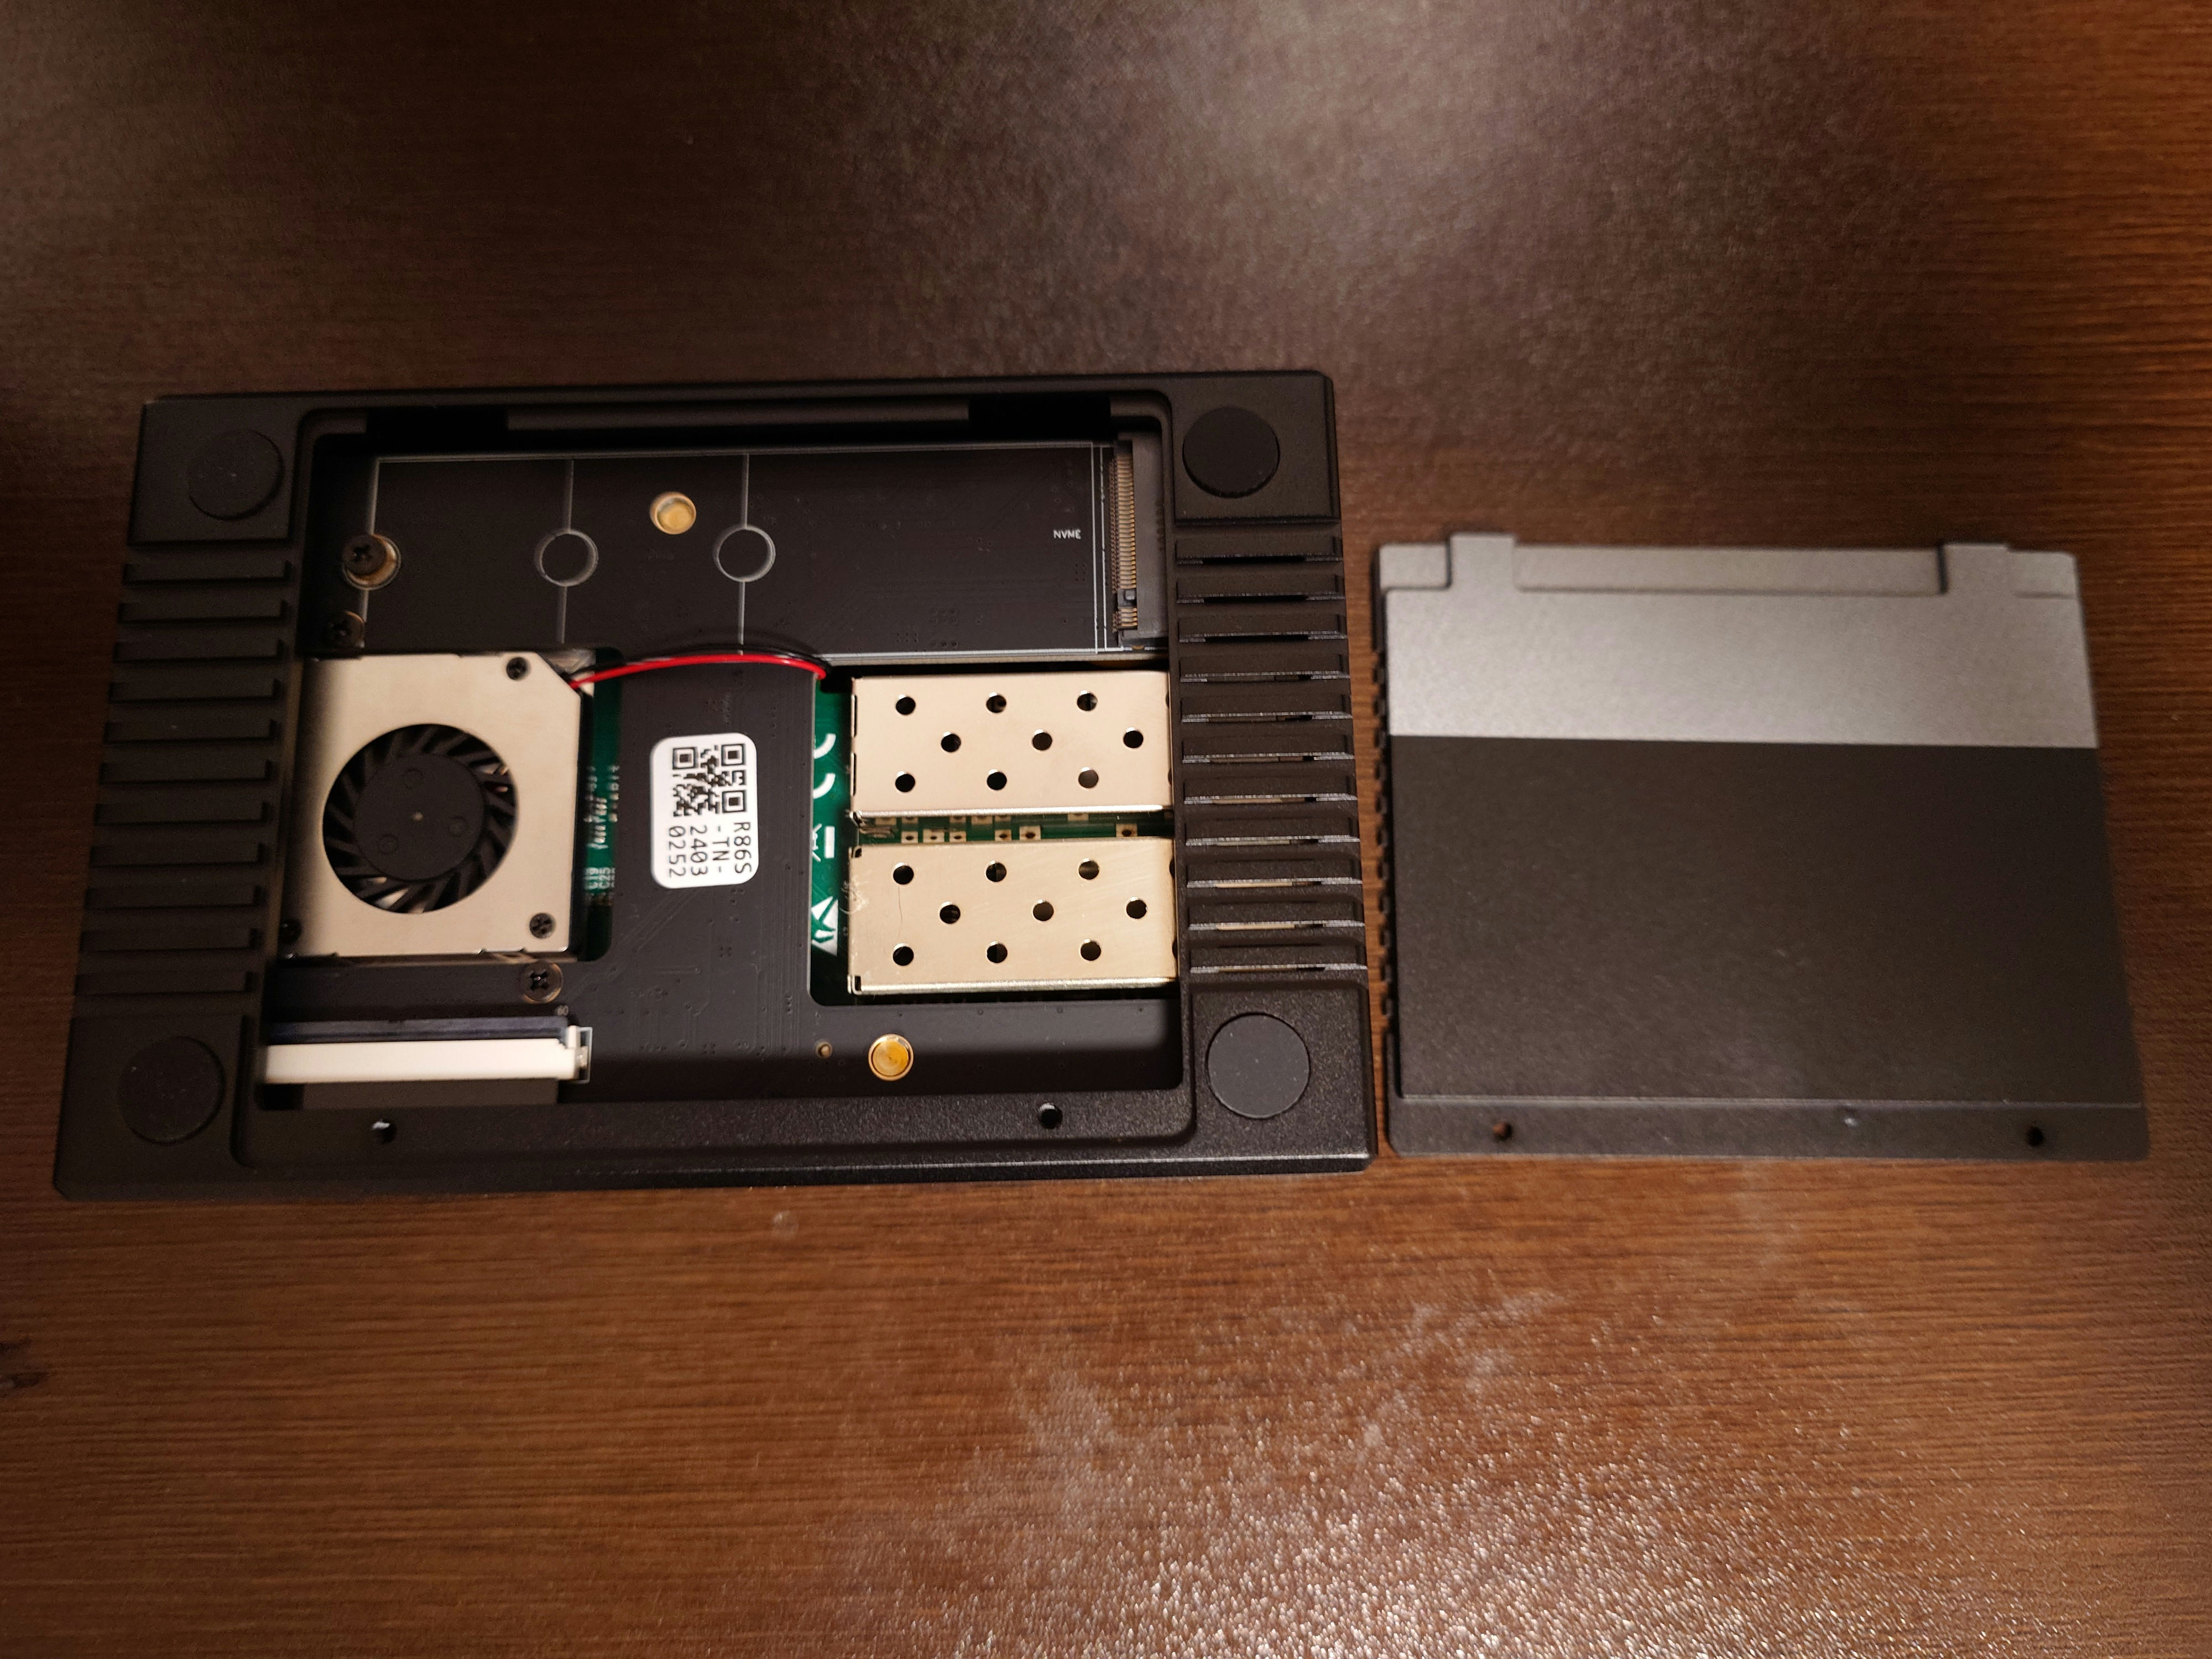
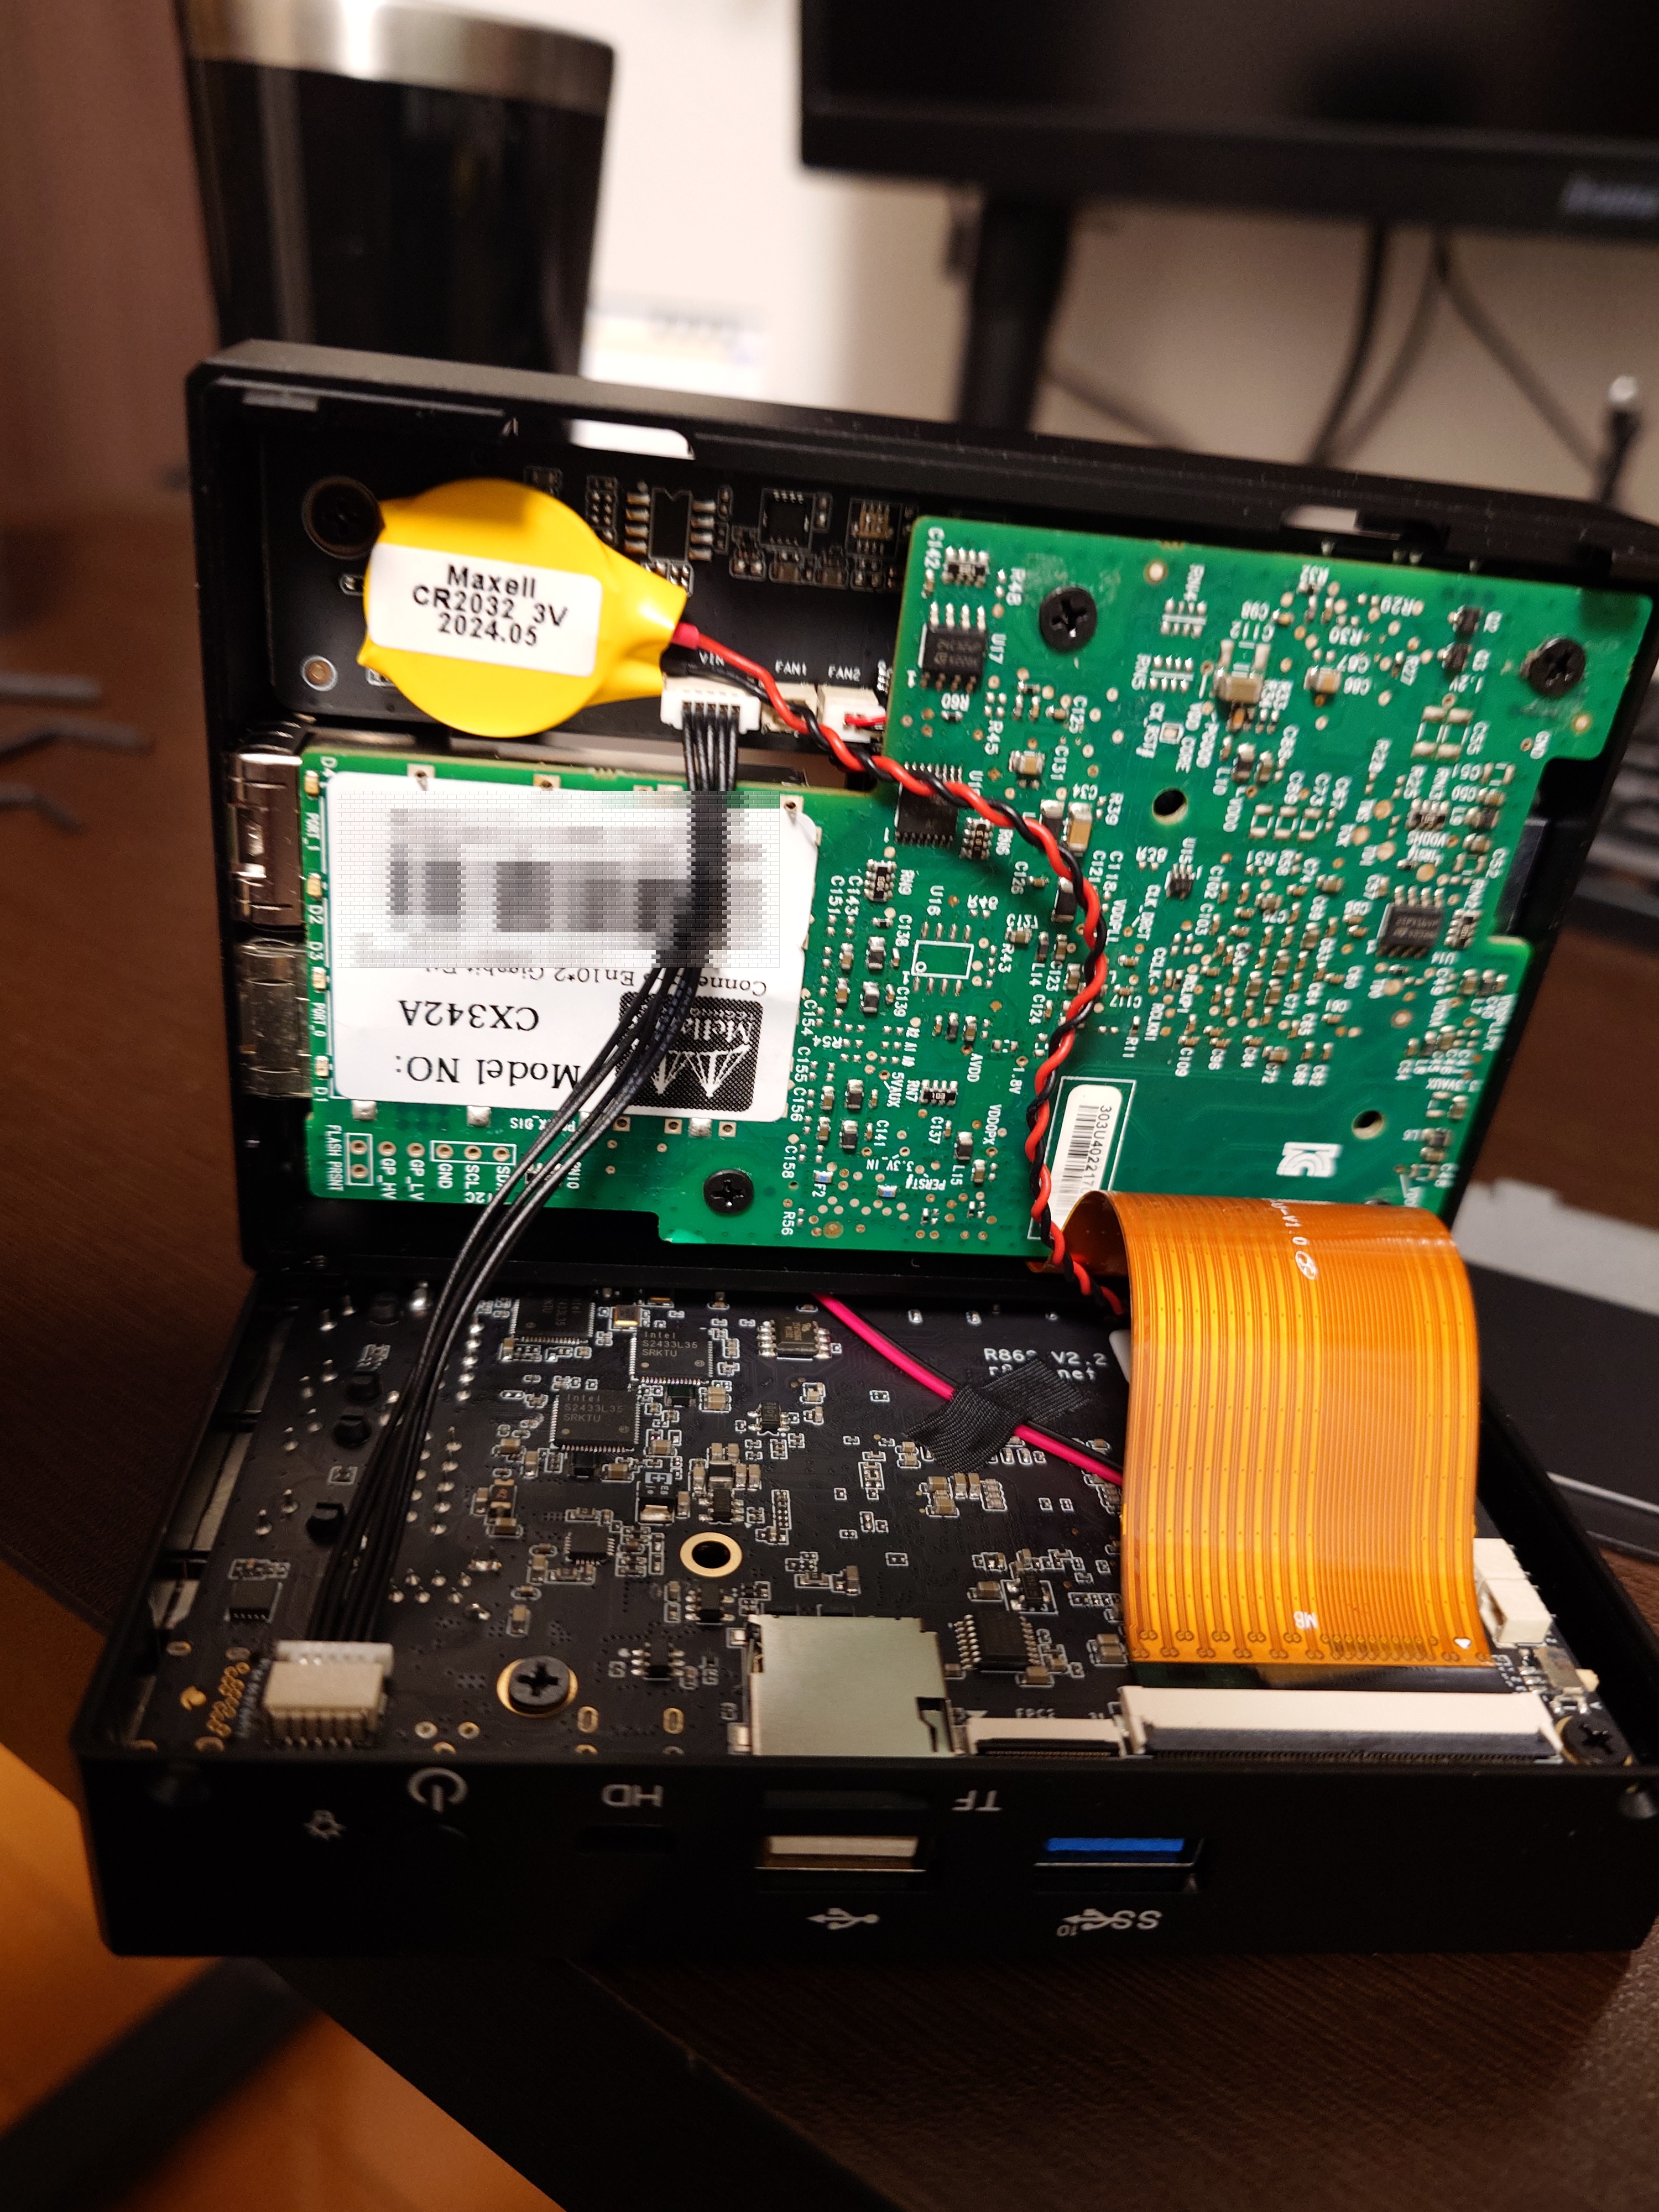
R86S U1の分解像

外観

裏ブタを開けたところ

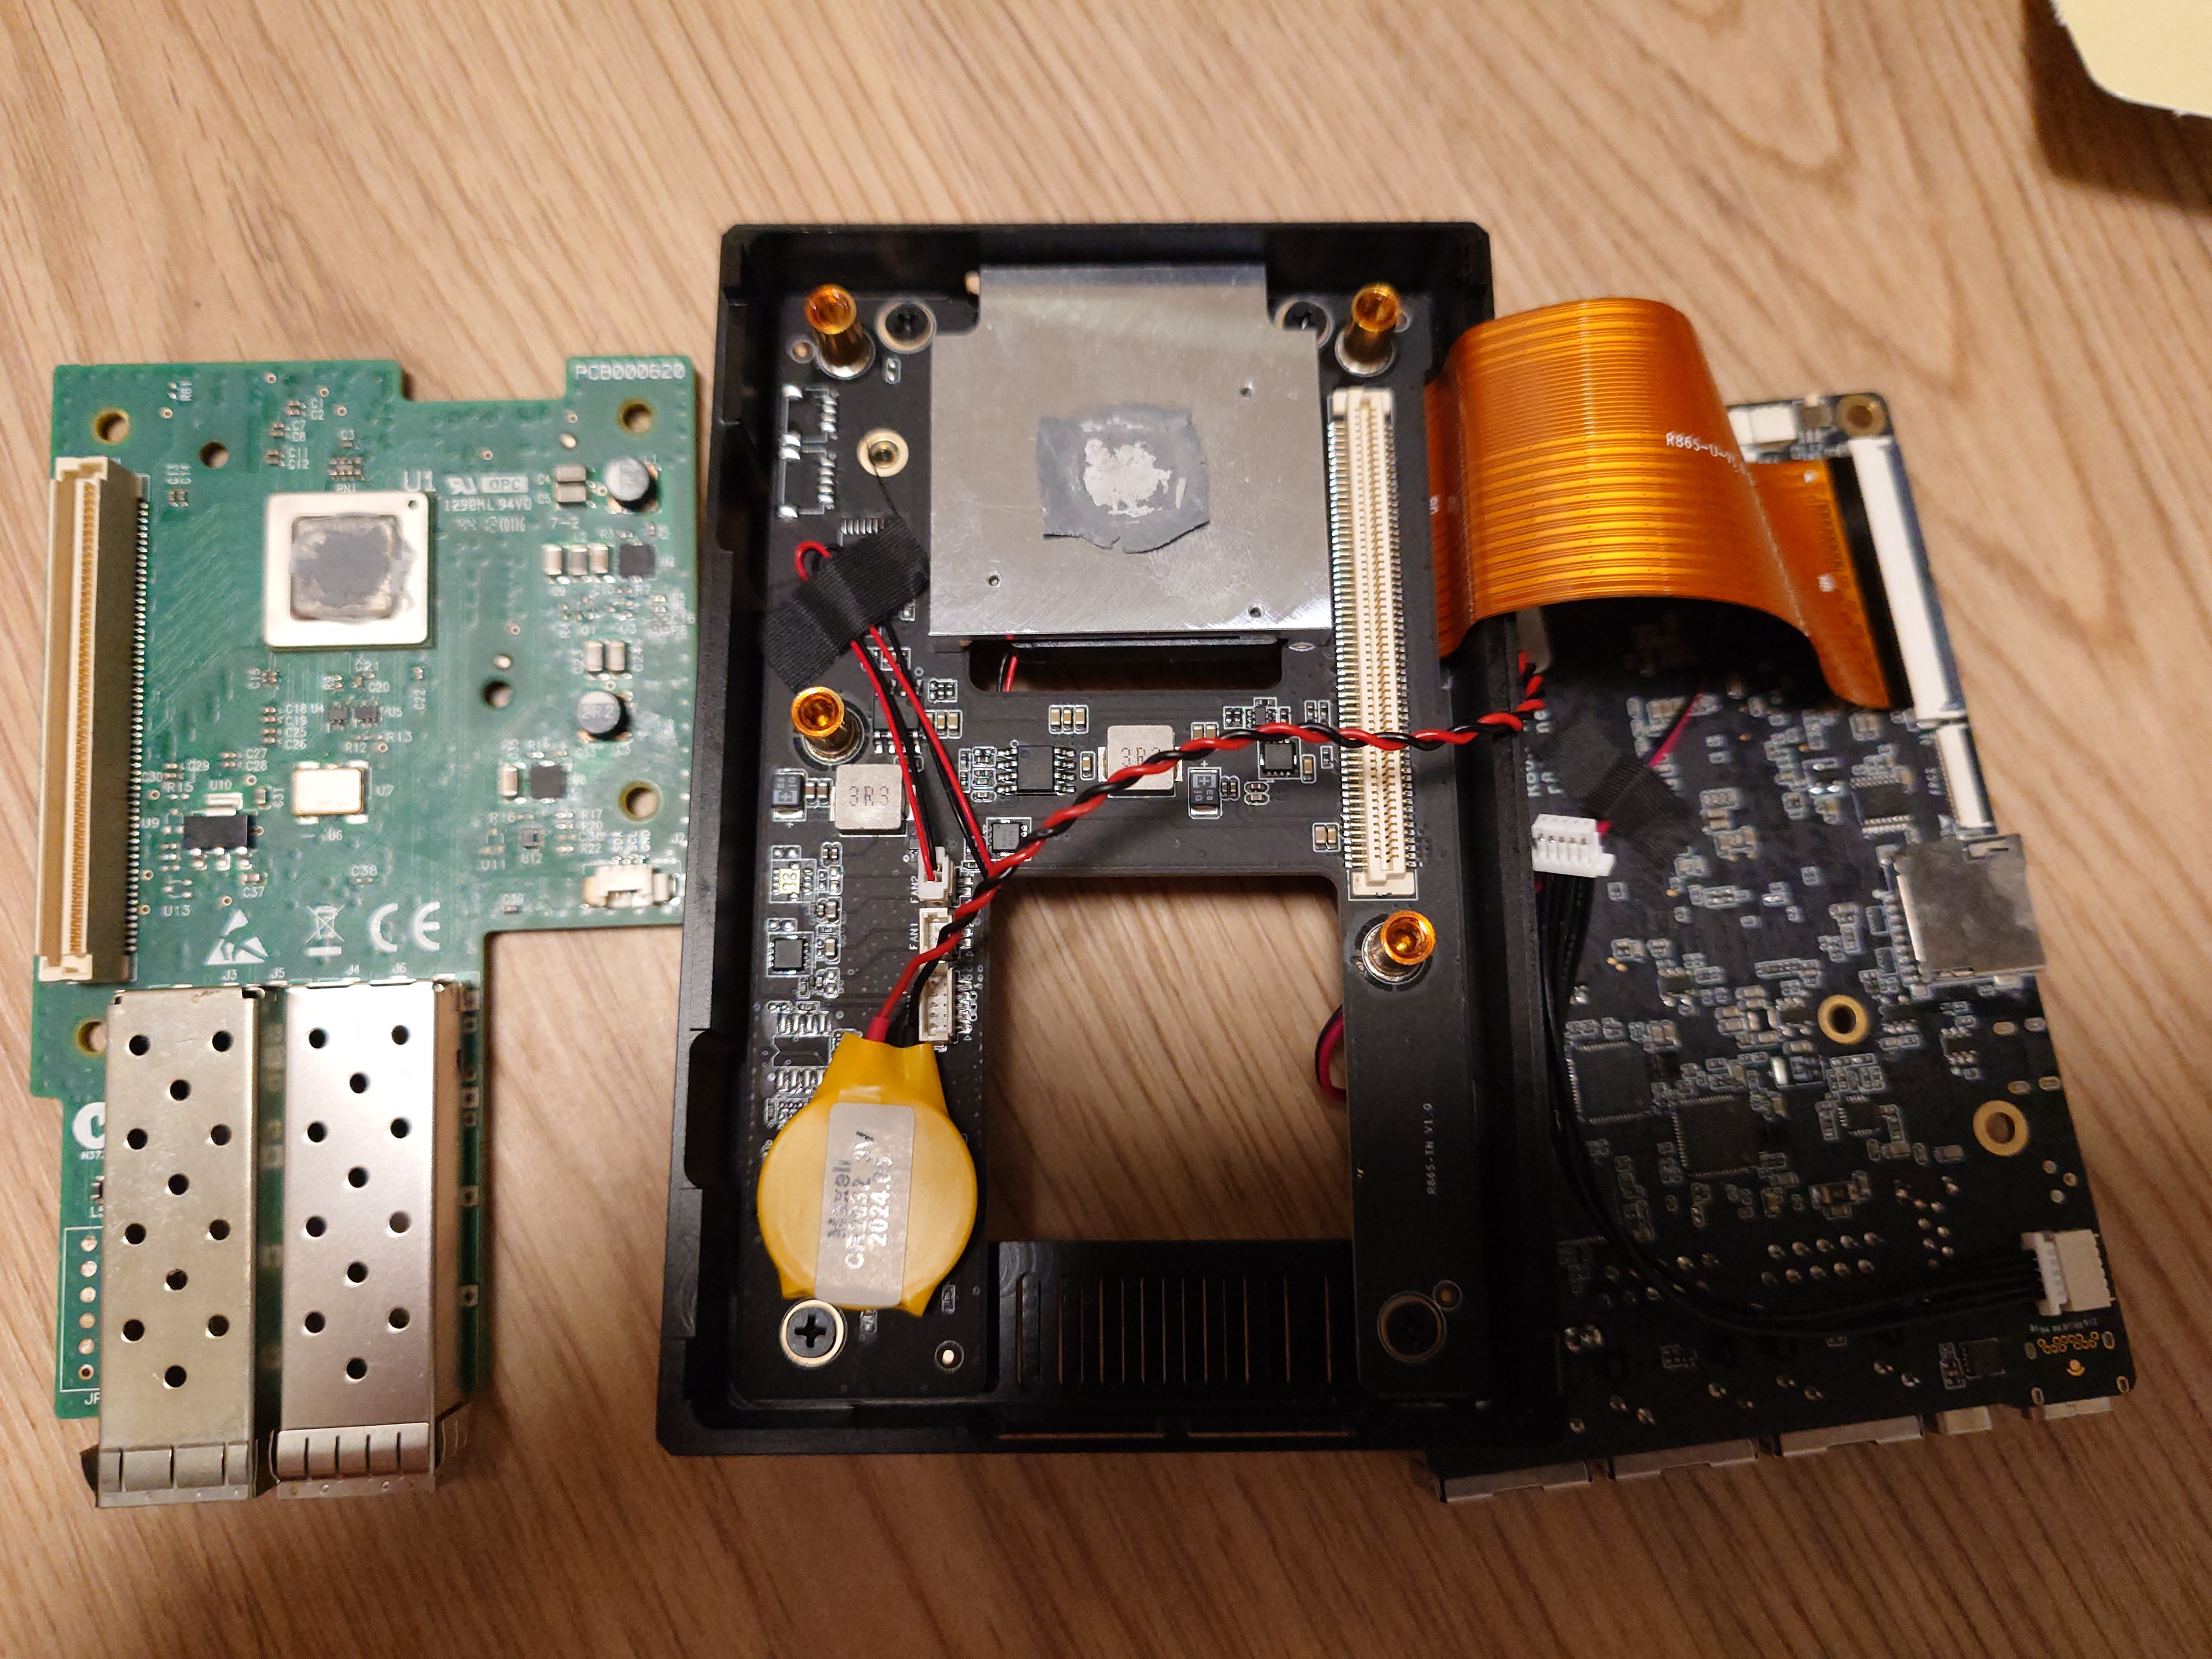
本体を開けたところ

手前からCPUボード、NIC、NICの裏板の三層構造になっている。

各ボードを繋ぐケーブルが邪魔なので、作業するときは外すとやりやすい。

FPC(フレキシブル基板、フレキシブルケーブル)は以下の手順で外せる。左右についている爪を触ると折れるので触らない方がいい。但し折れても支障はない。

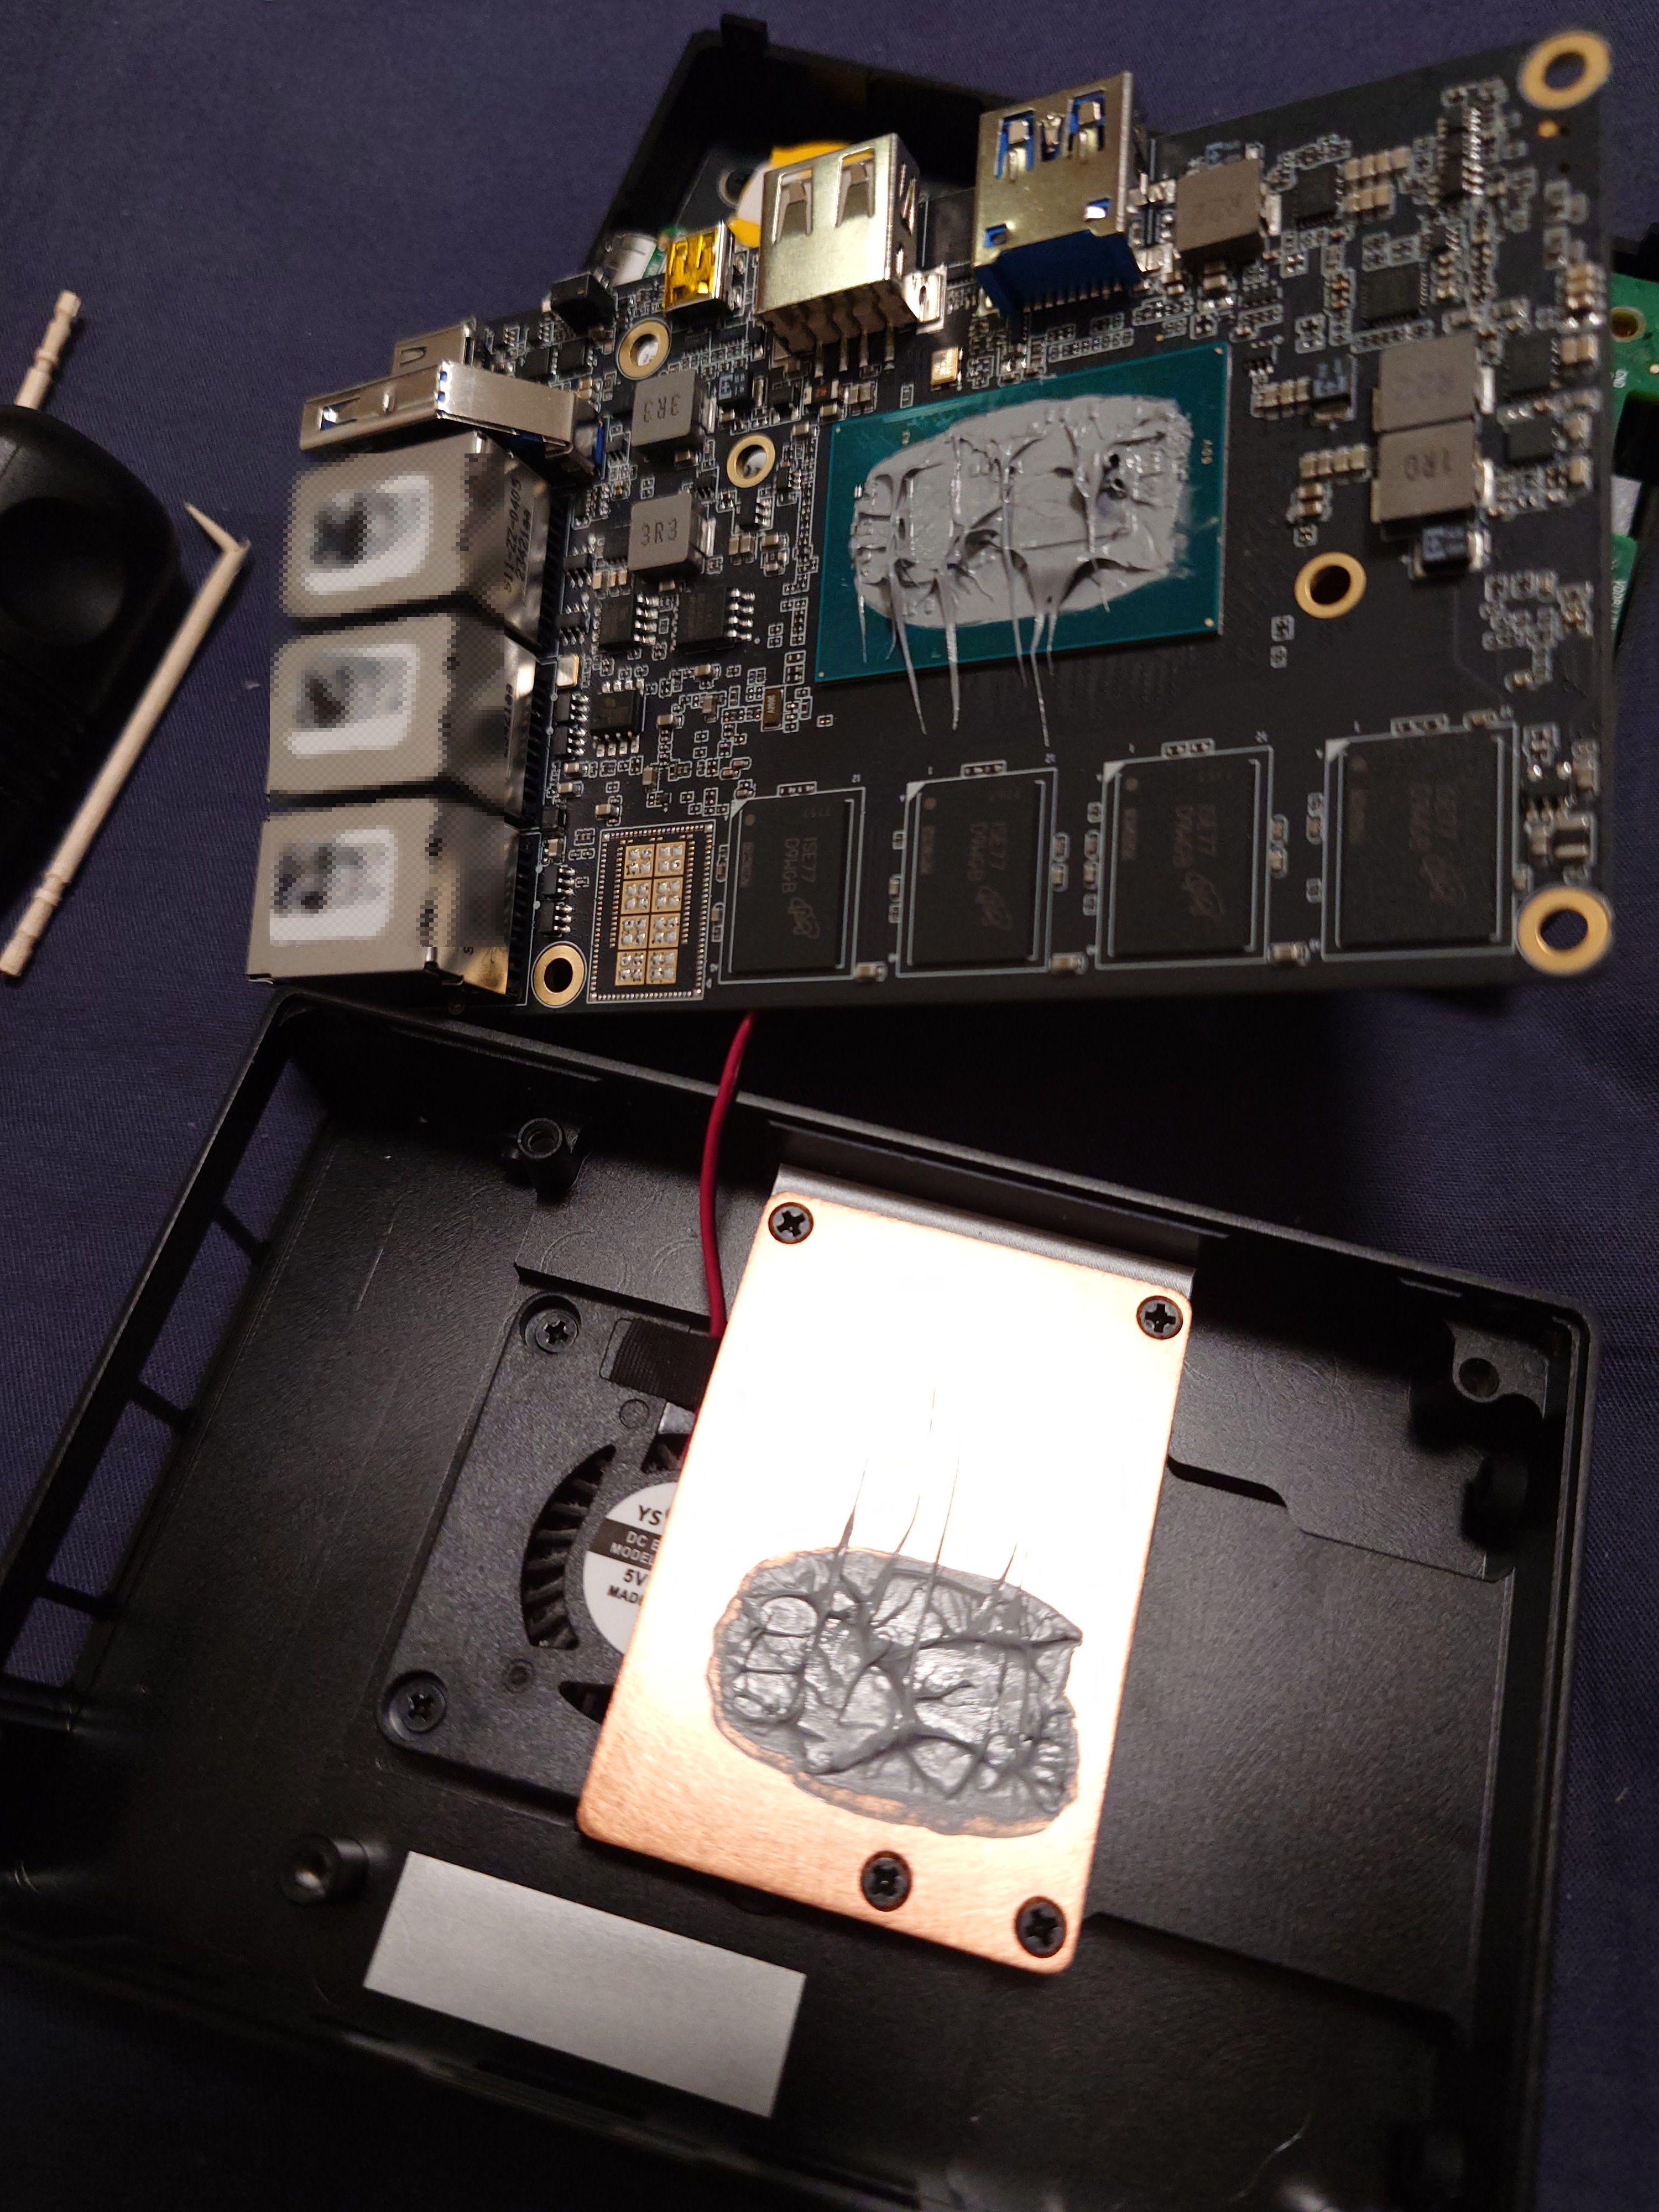
CPUボードを開けたところ

グリスが酷い。閉じ直すときは、ここまで塗る必要はなく、注射器から1mmほど出しておけばよい。

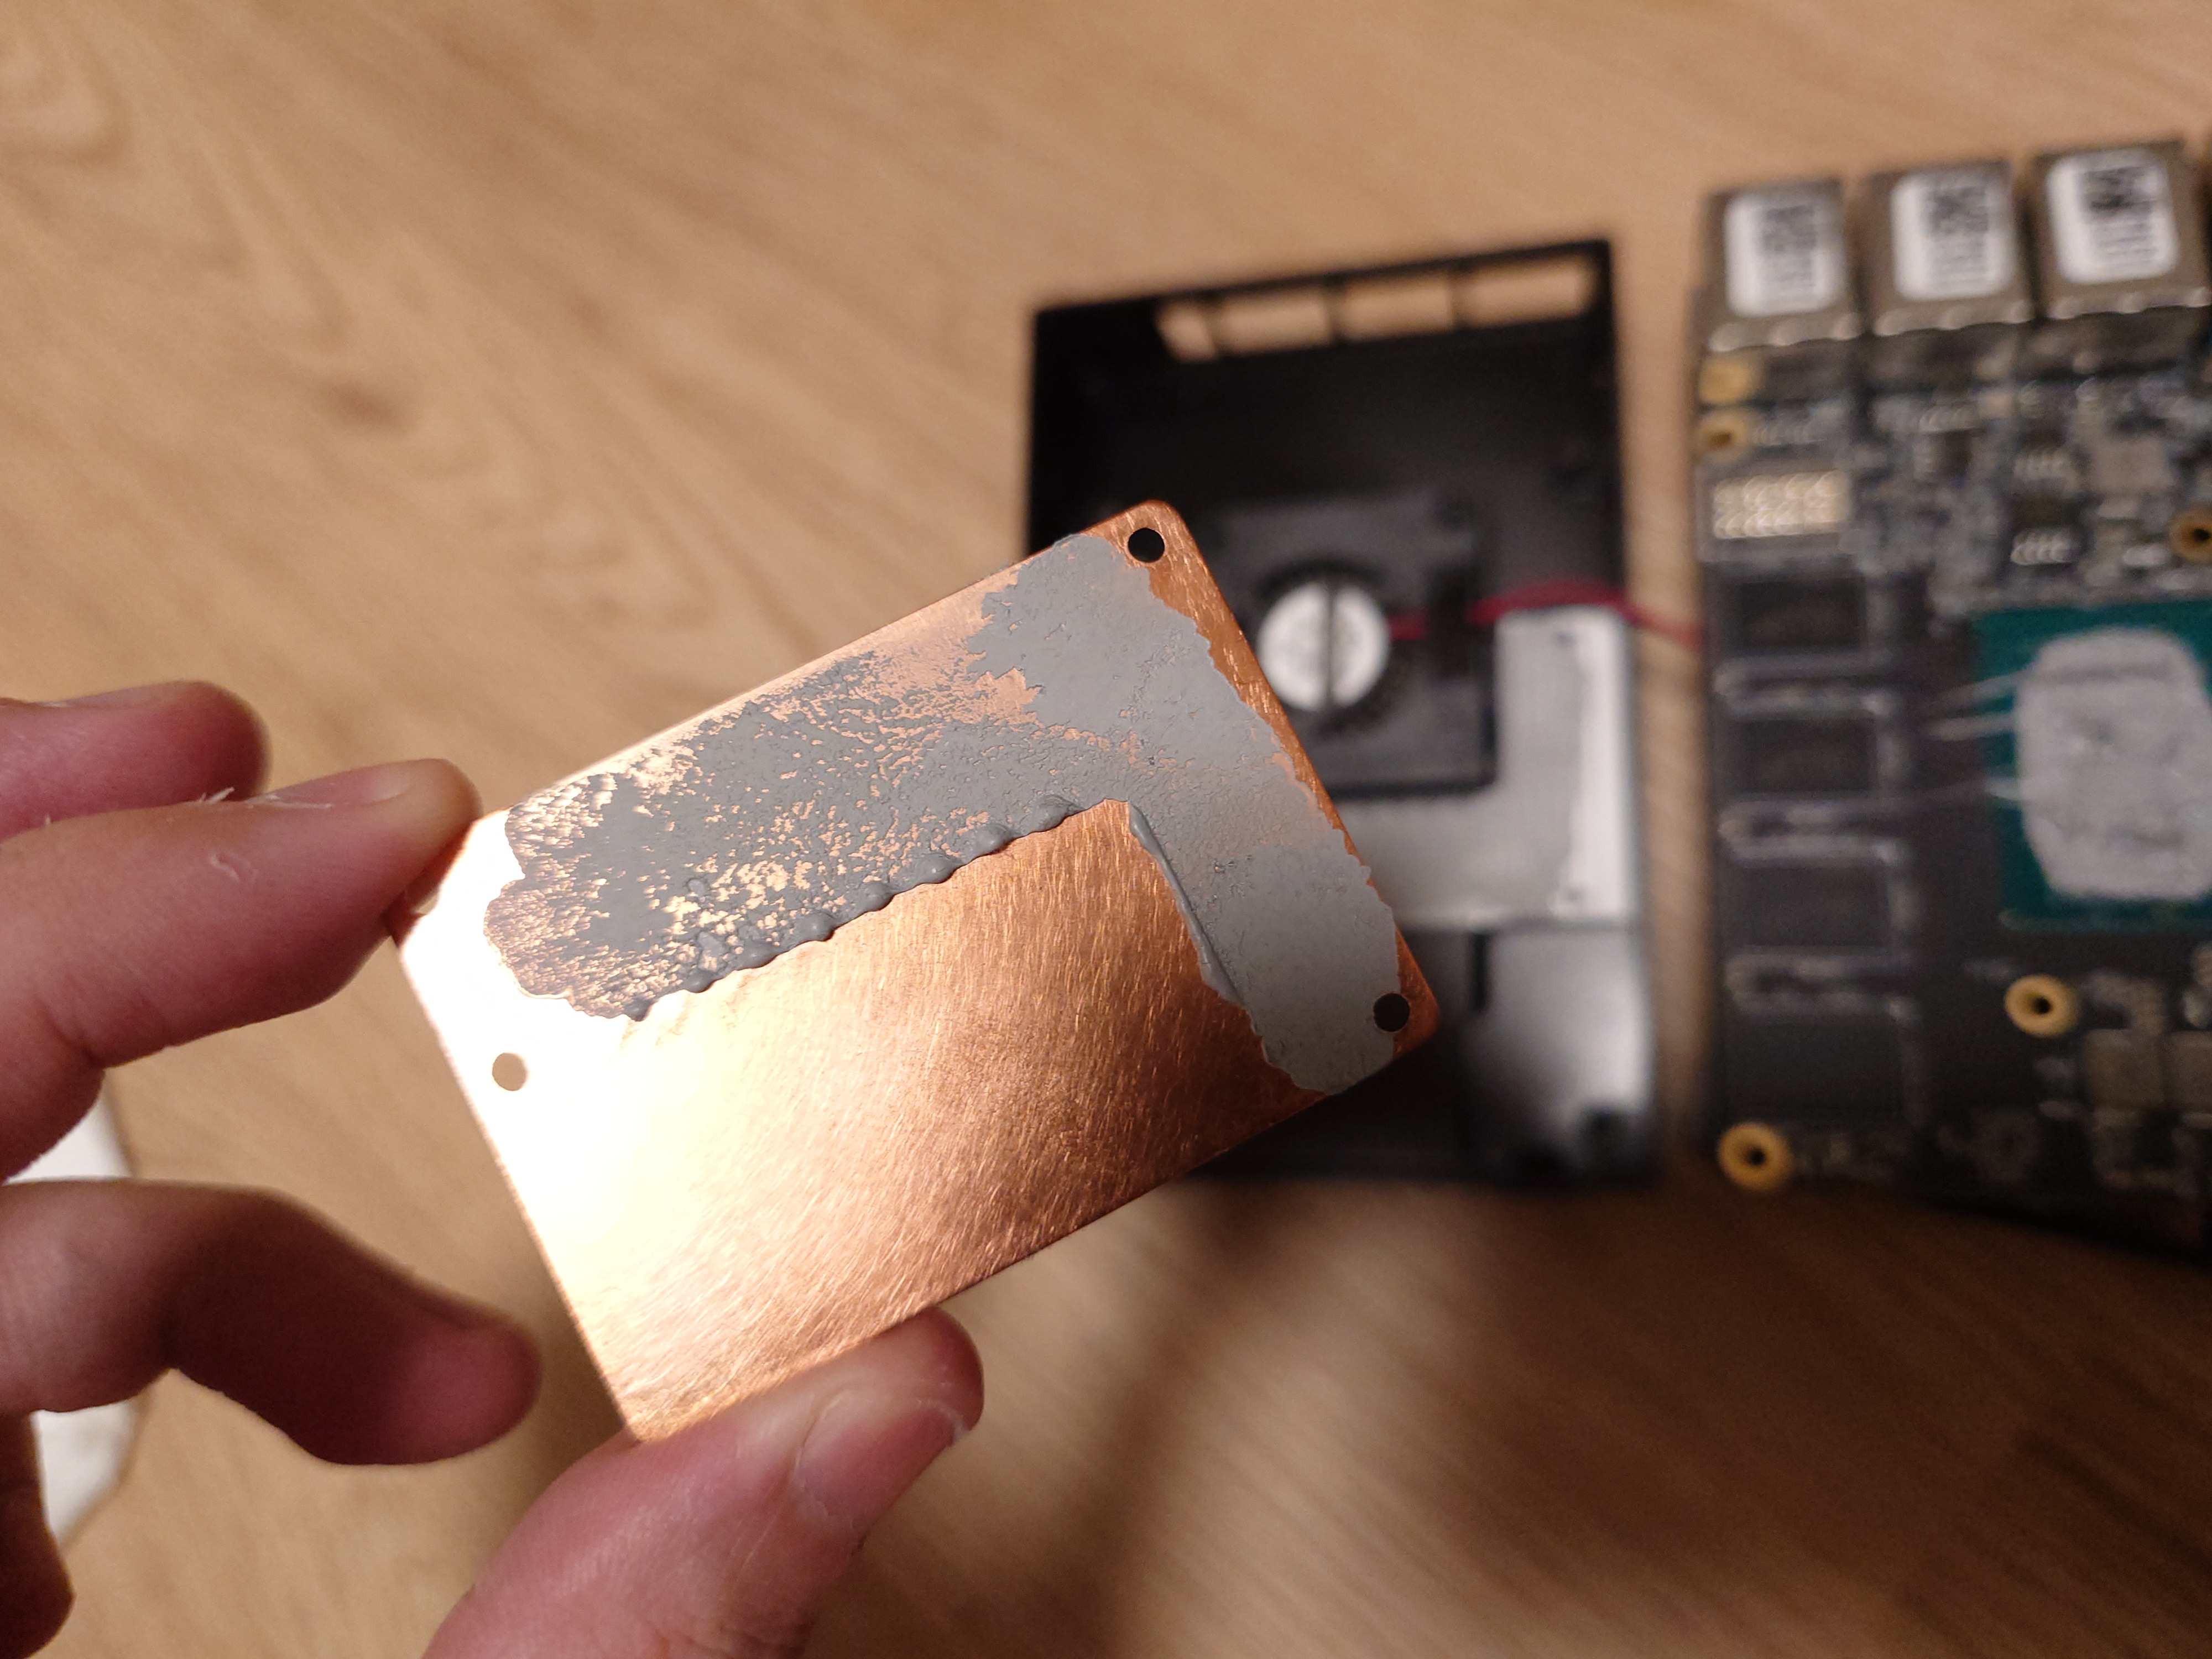
CPUヒートシンク?

蓋側にはケースに熱を伝えるための銅の板がついており、やはりグリスがたっぷりついている。

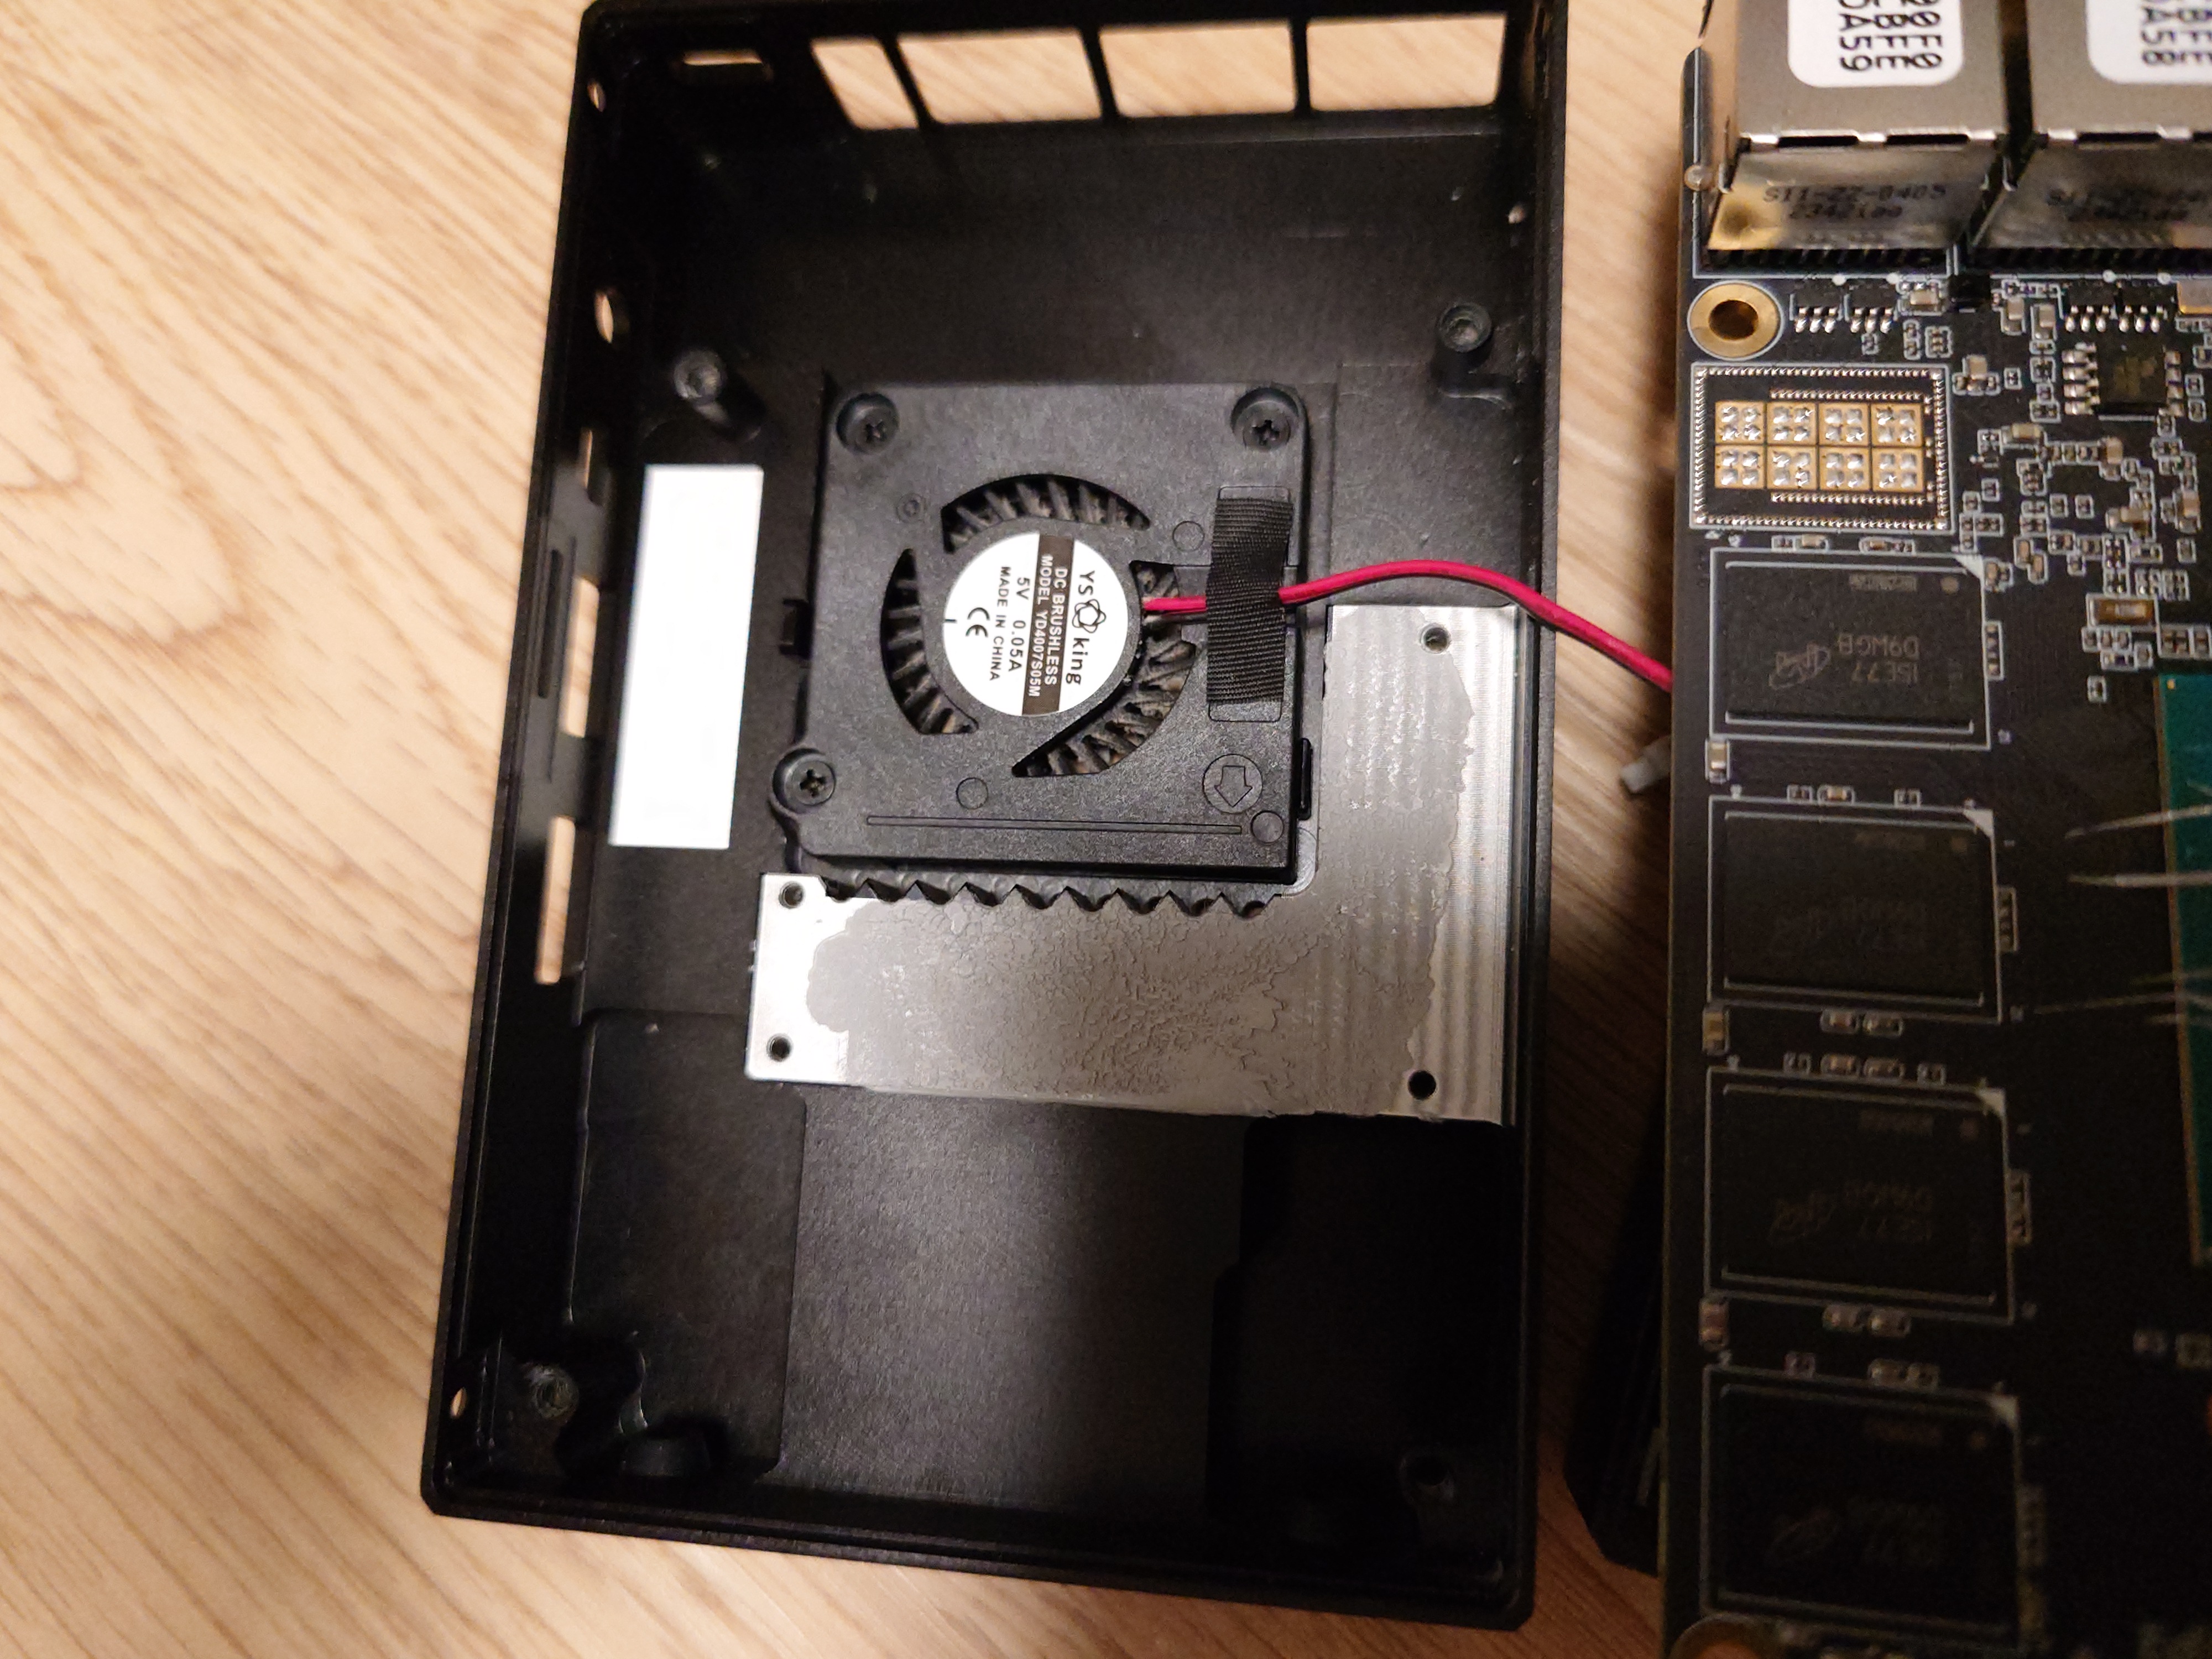
CPUファン

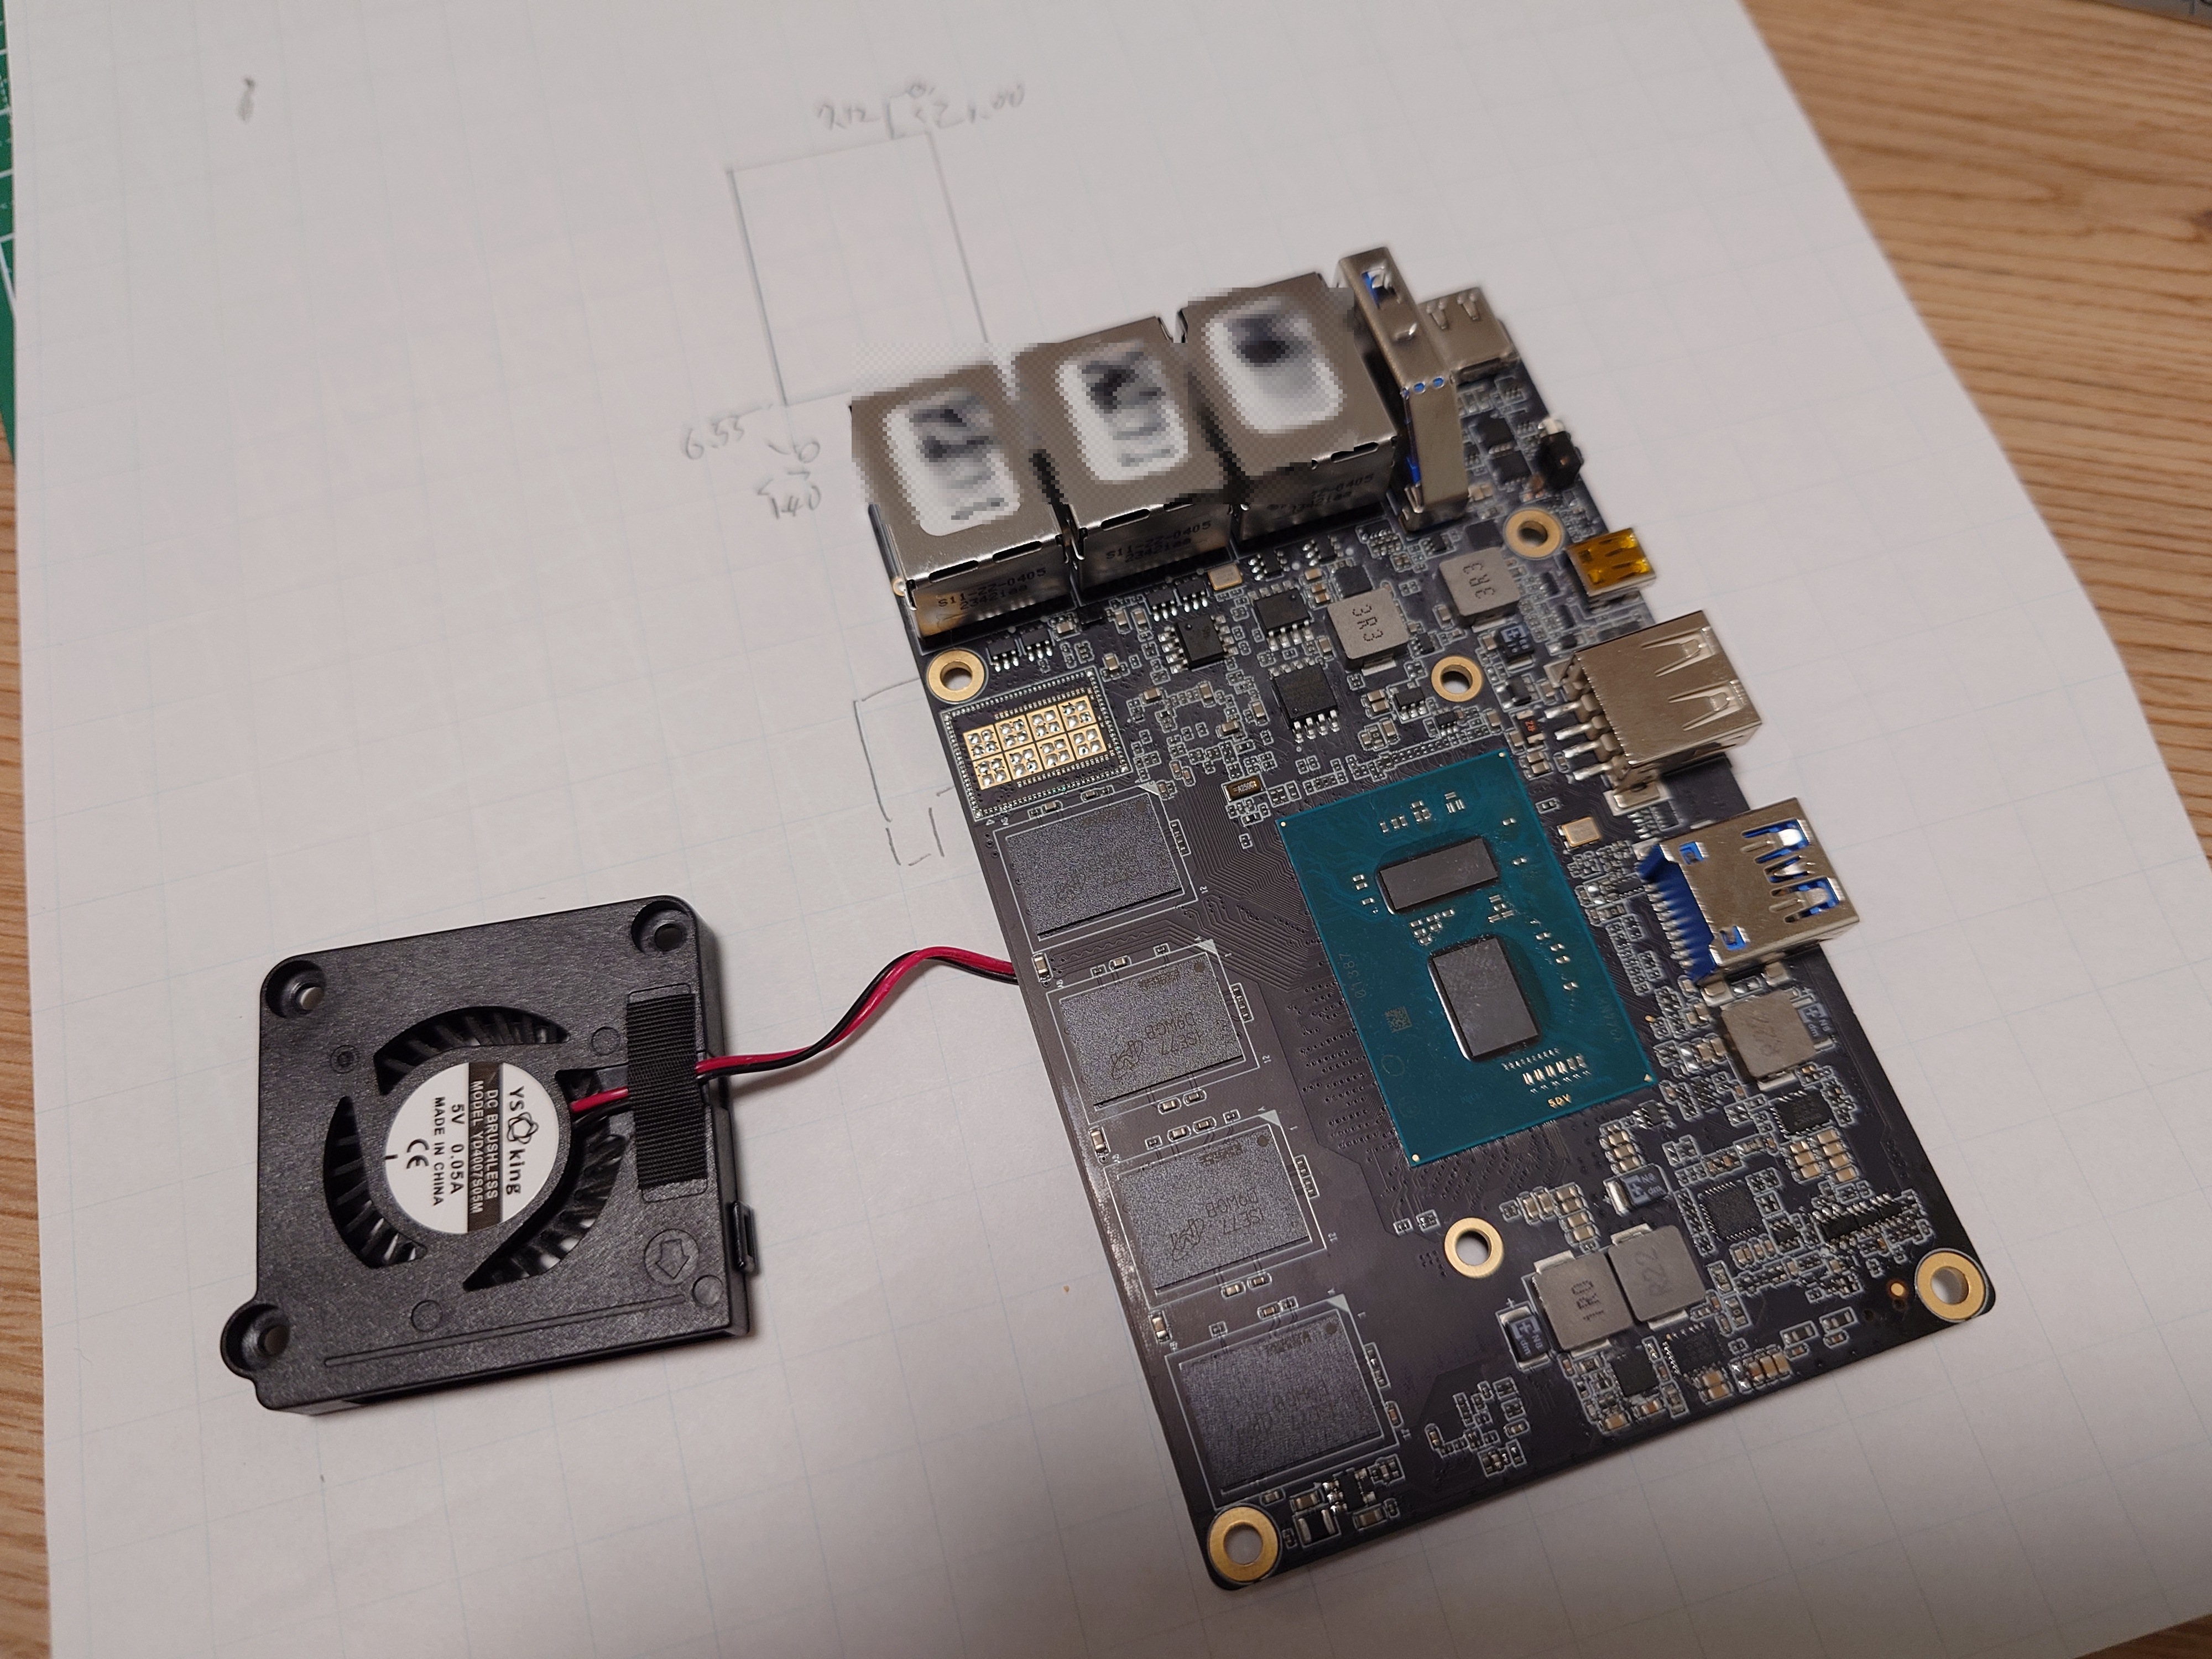
銅板やヒートシンクを冷やしているというよりはケース表面のヒートシンク形状を浸すための装置に見える。40 x 40 x 7mmの2pin形式なら互換性があるものと思われる。

ピンの形状は検証していないが、調べた限りJST SH1.0MMらしい。ハウジングはこの手の製品が使えると思われる。

耐久性が心配になるサイズだが、この方式であれば上に60mmファンを雑に置いておいても成立しそうな気はした。

CPUボード単体

CPUにはヒートスプレッダが二つ付いており、ノートPCによくあるタイプに見えた。

NIC側を開けたところ

NIC本体と裏板は特殊なコネクタで繋がっており、上に引っ張ると抜ける。調べた感じOCP2.0という規格らしい。

OCPはOpen Compute Projectの略で、ラックサーバー用の規格のようだ。一般的にOCP2.0メザニンカードと呼ばれているらしい?

このコネクタを備えた変換PCIeカードも流通しており、普通のPCに繋ぐこともできるようだ。

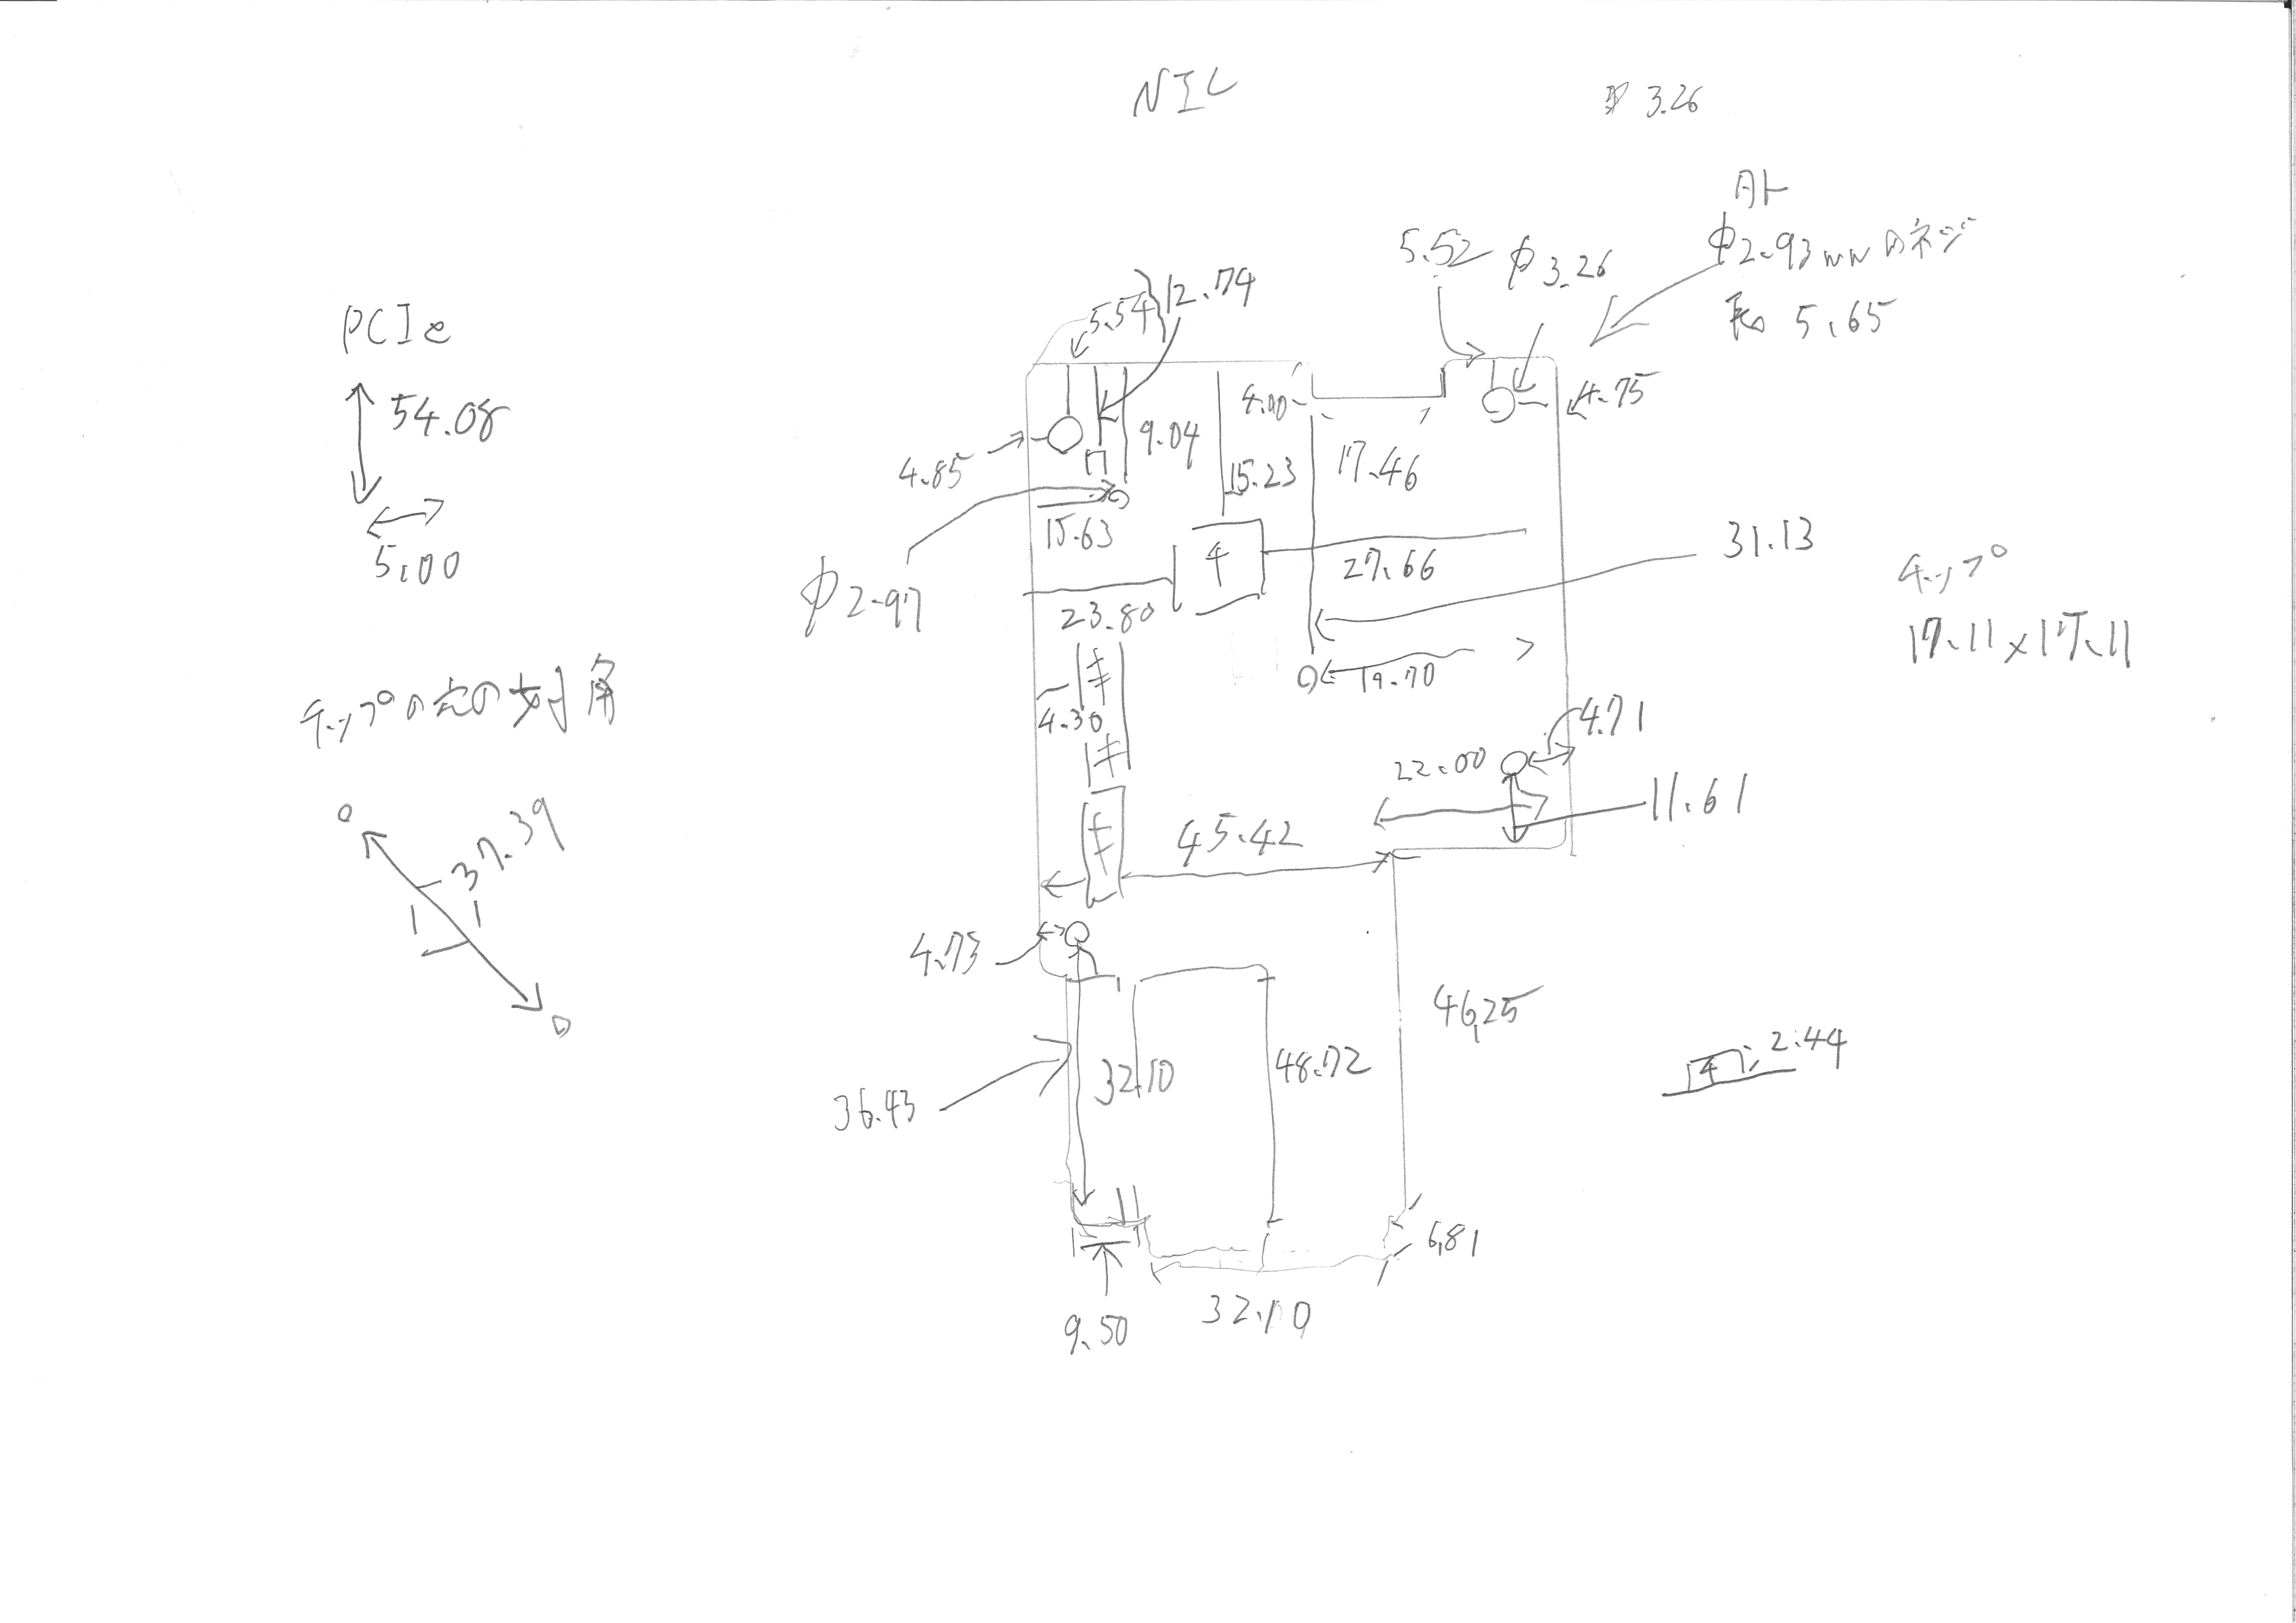
R86S U1の寸法記録

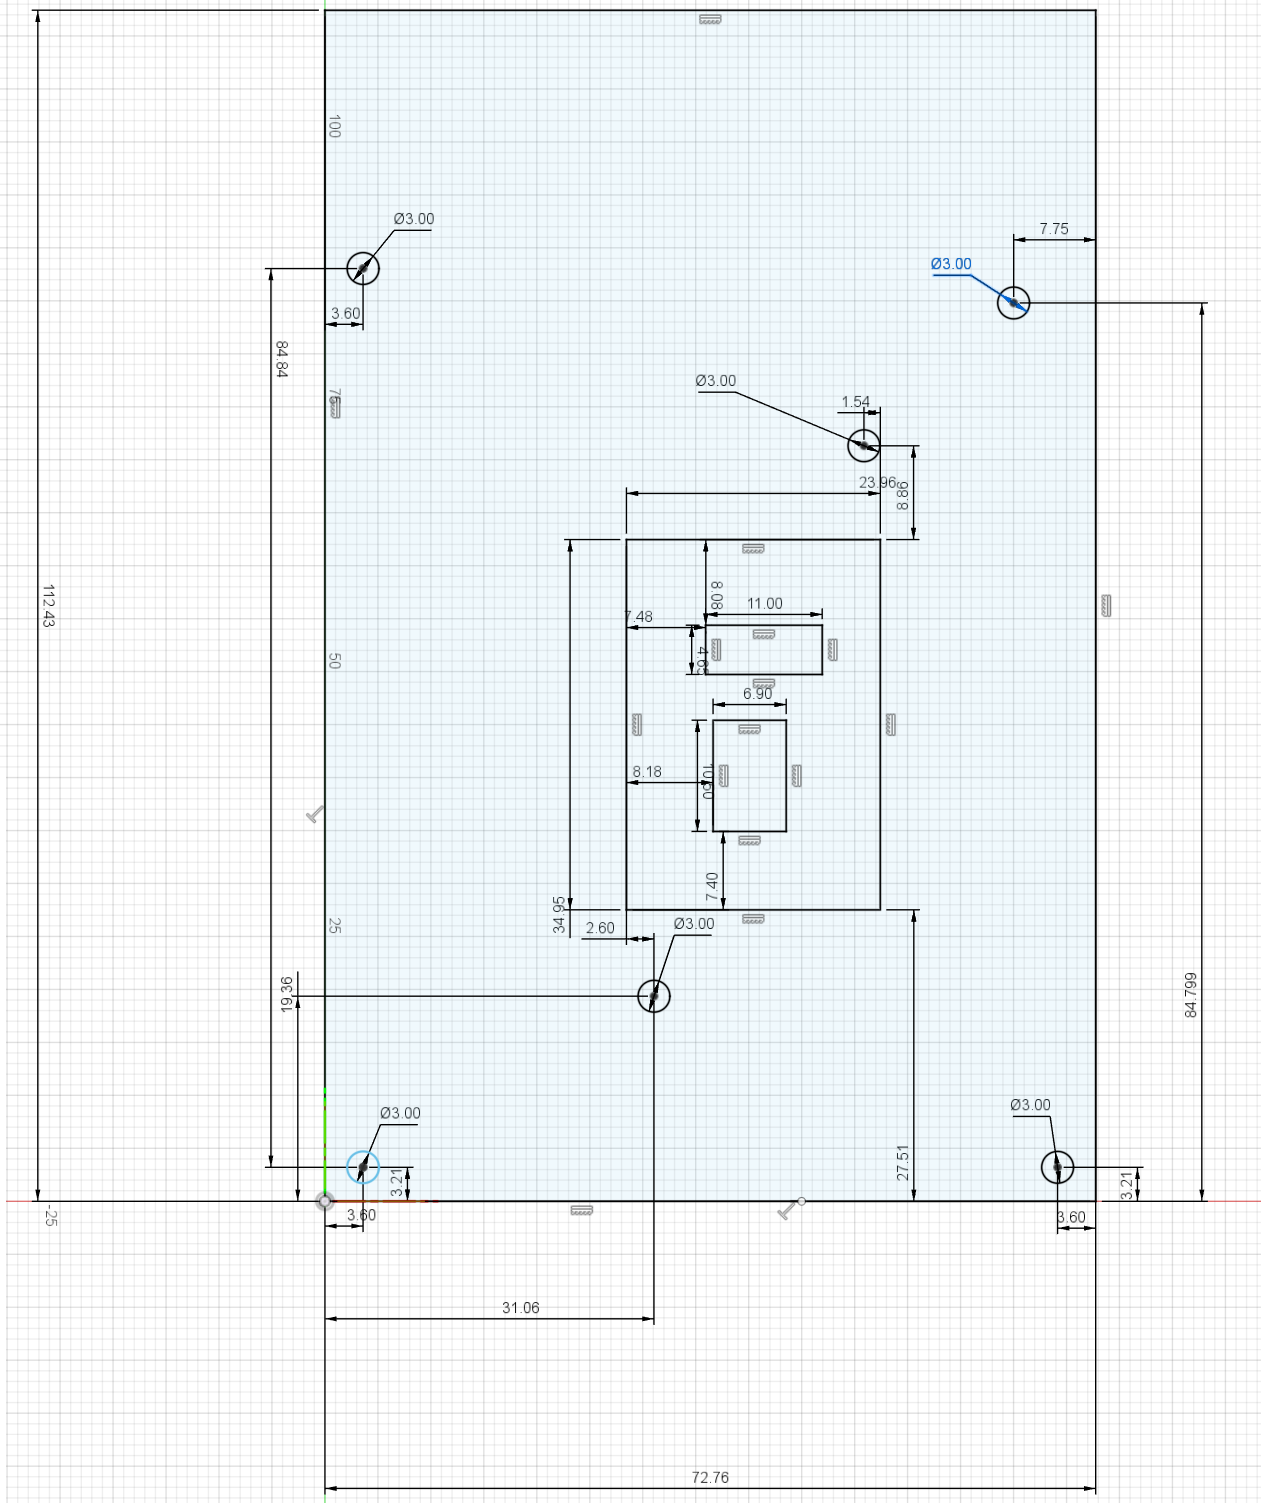
CPUボード

Autodesk Fusionで描いたもののスクショ。誤差+-0.50mm程度と思われる。

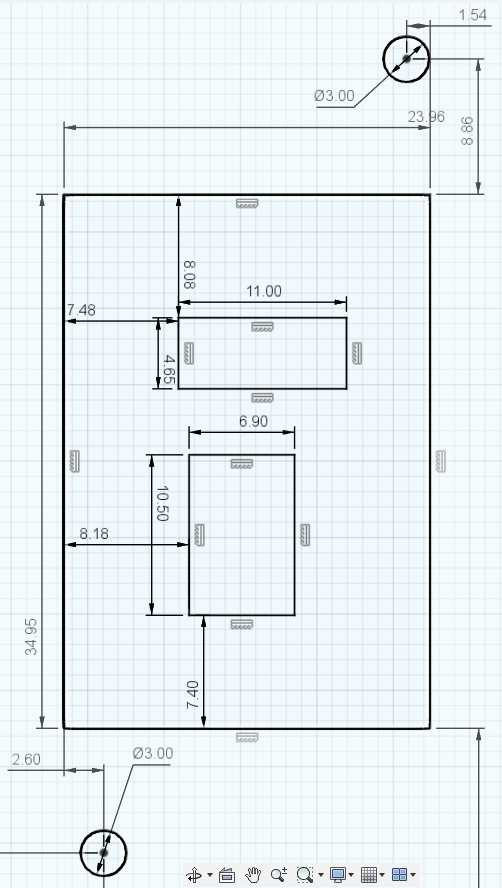
CPU本体

Autodesk Fusionで描いたもののスクショ。誤差+-1.00mm程度と思われる。

Rが付いて盛り上がった形をしているヒートスプレッダのサイズが上手く取れなかったので、大まかな図。特に上下のスプレッダの間隔は怪しい。

NIC

手描きのスケッチ。ネジ穴の直径を書いているが、実際はすべて3.00mmと思われる。

「チ」とあるのはNICのチップ。「チ」2.44mmはチップの高さ。

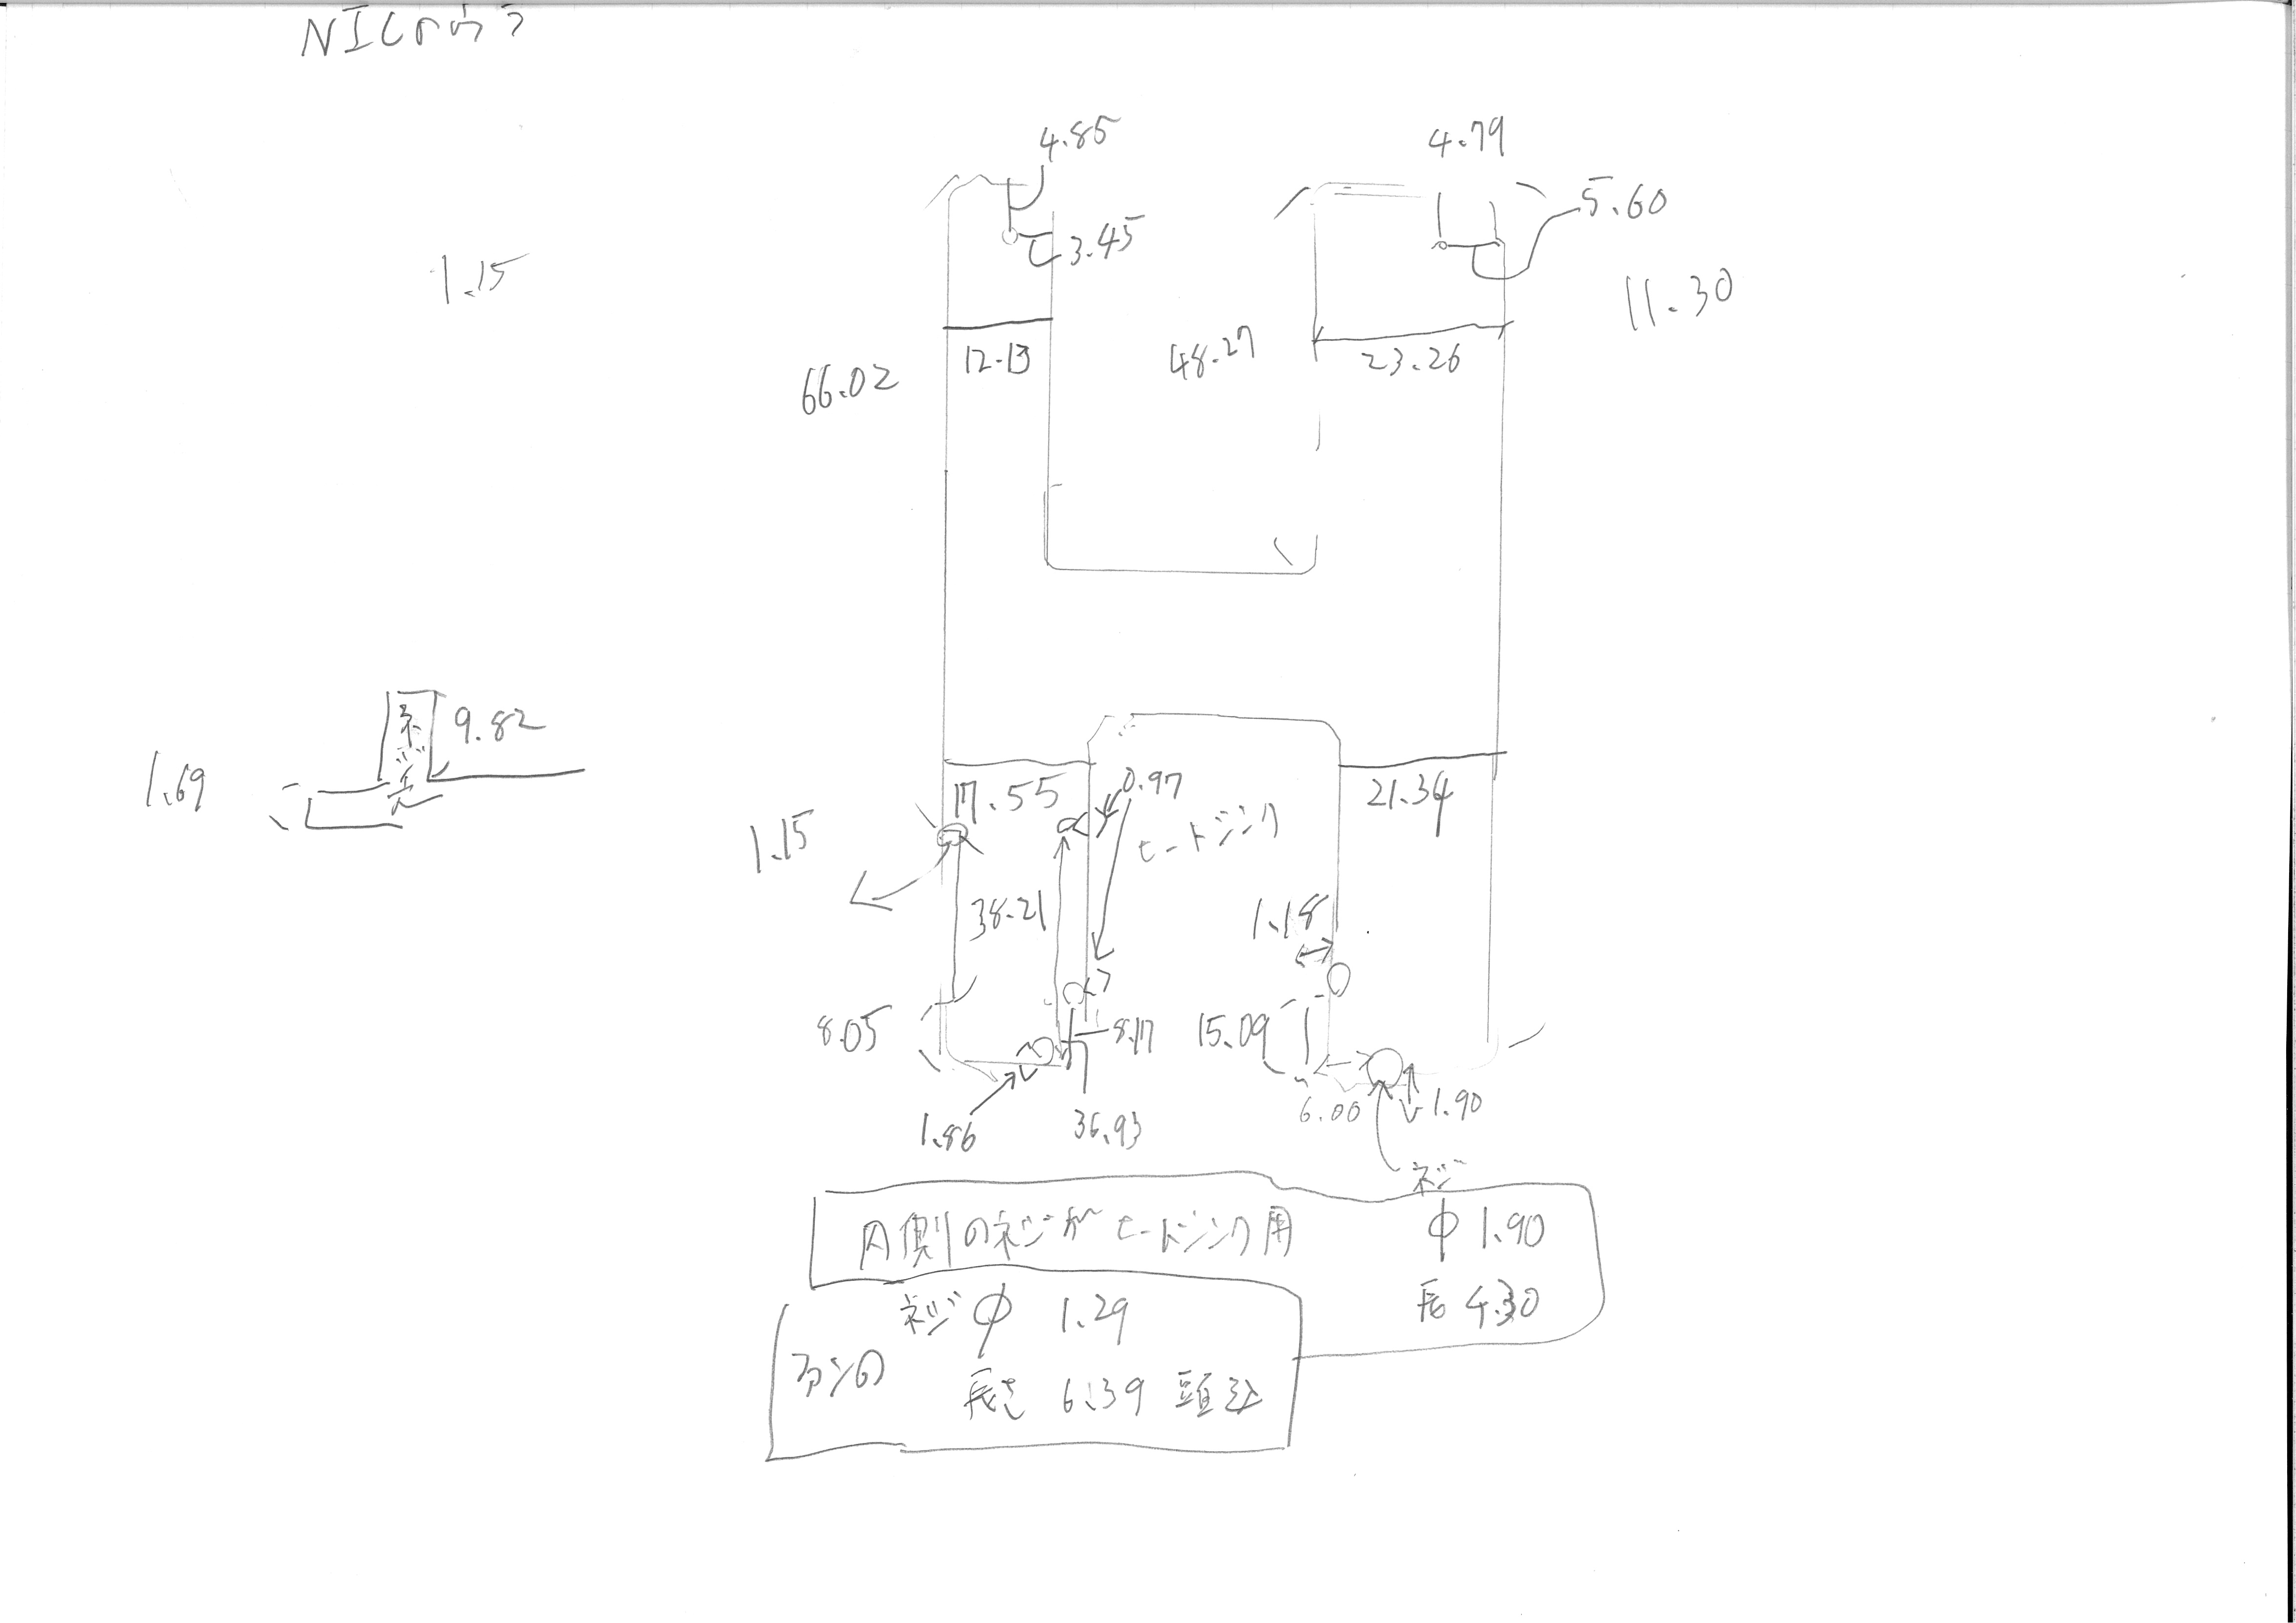
NICの裏板

NICがのっかってる板。NVMeSSDを挿すやつが載ってるやつ。ケース固定用のネジ穴とヒートシンク固定用のネジ穴で直径が異なる。

左にある凸型の図はNICを支えるスペーサーと、それが載った基板の寸法。

下にある「内側のネジがヒートシンク用」「ファンのネジ」とあるのはネジの寸法。

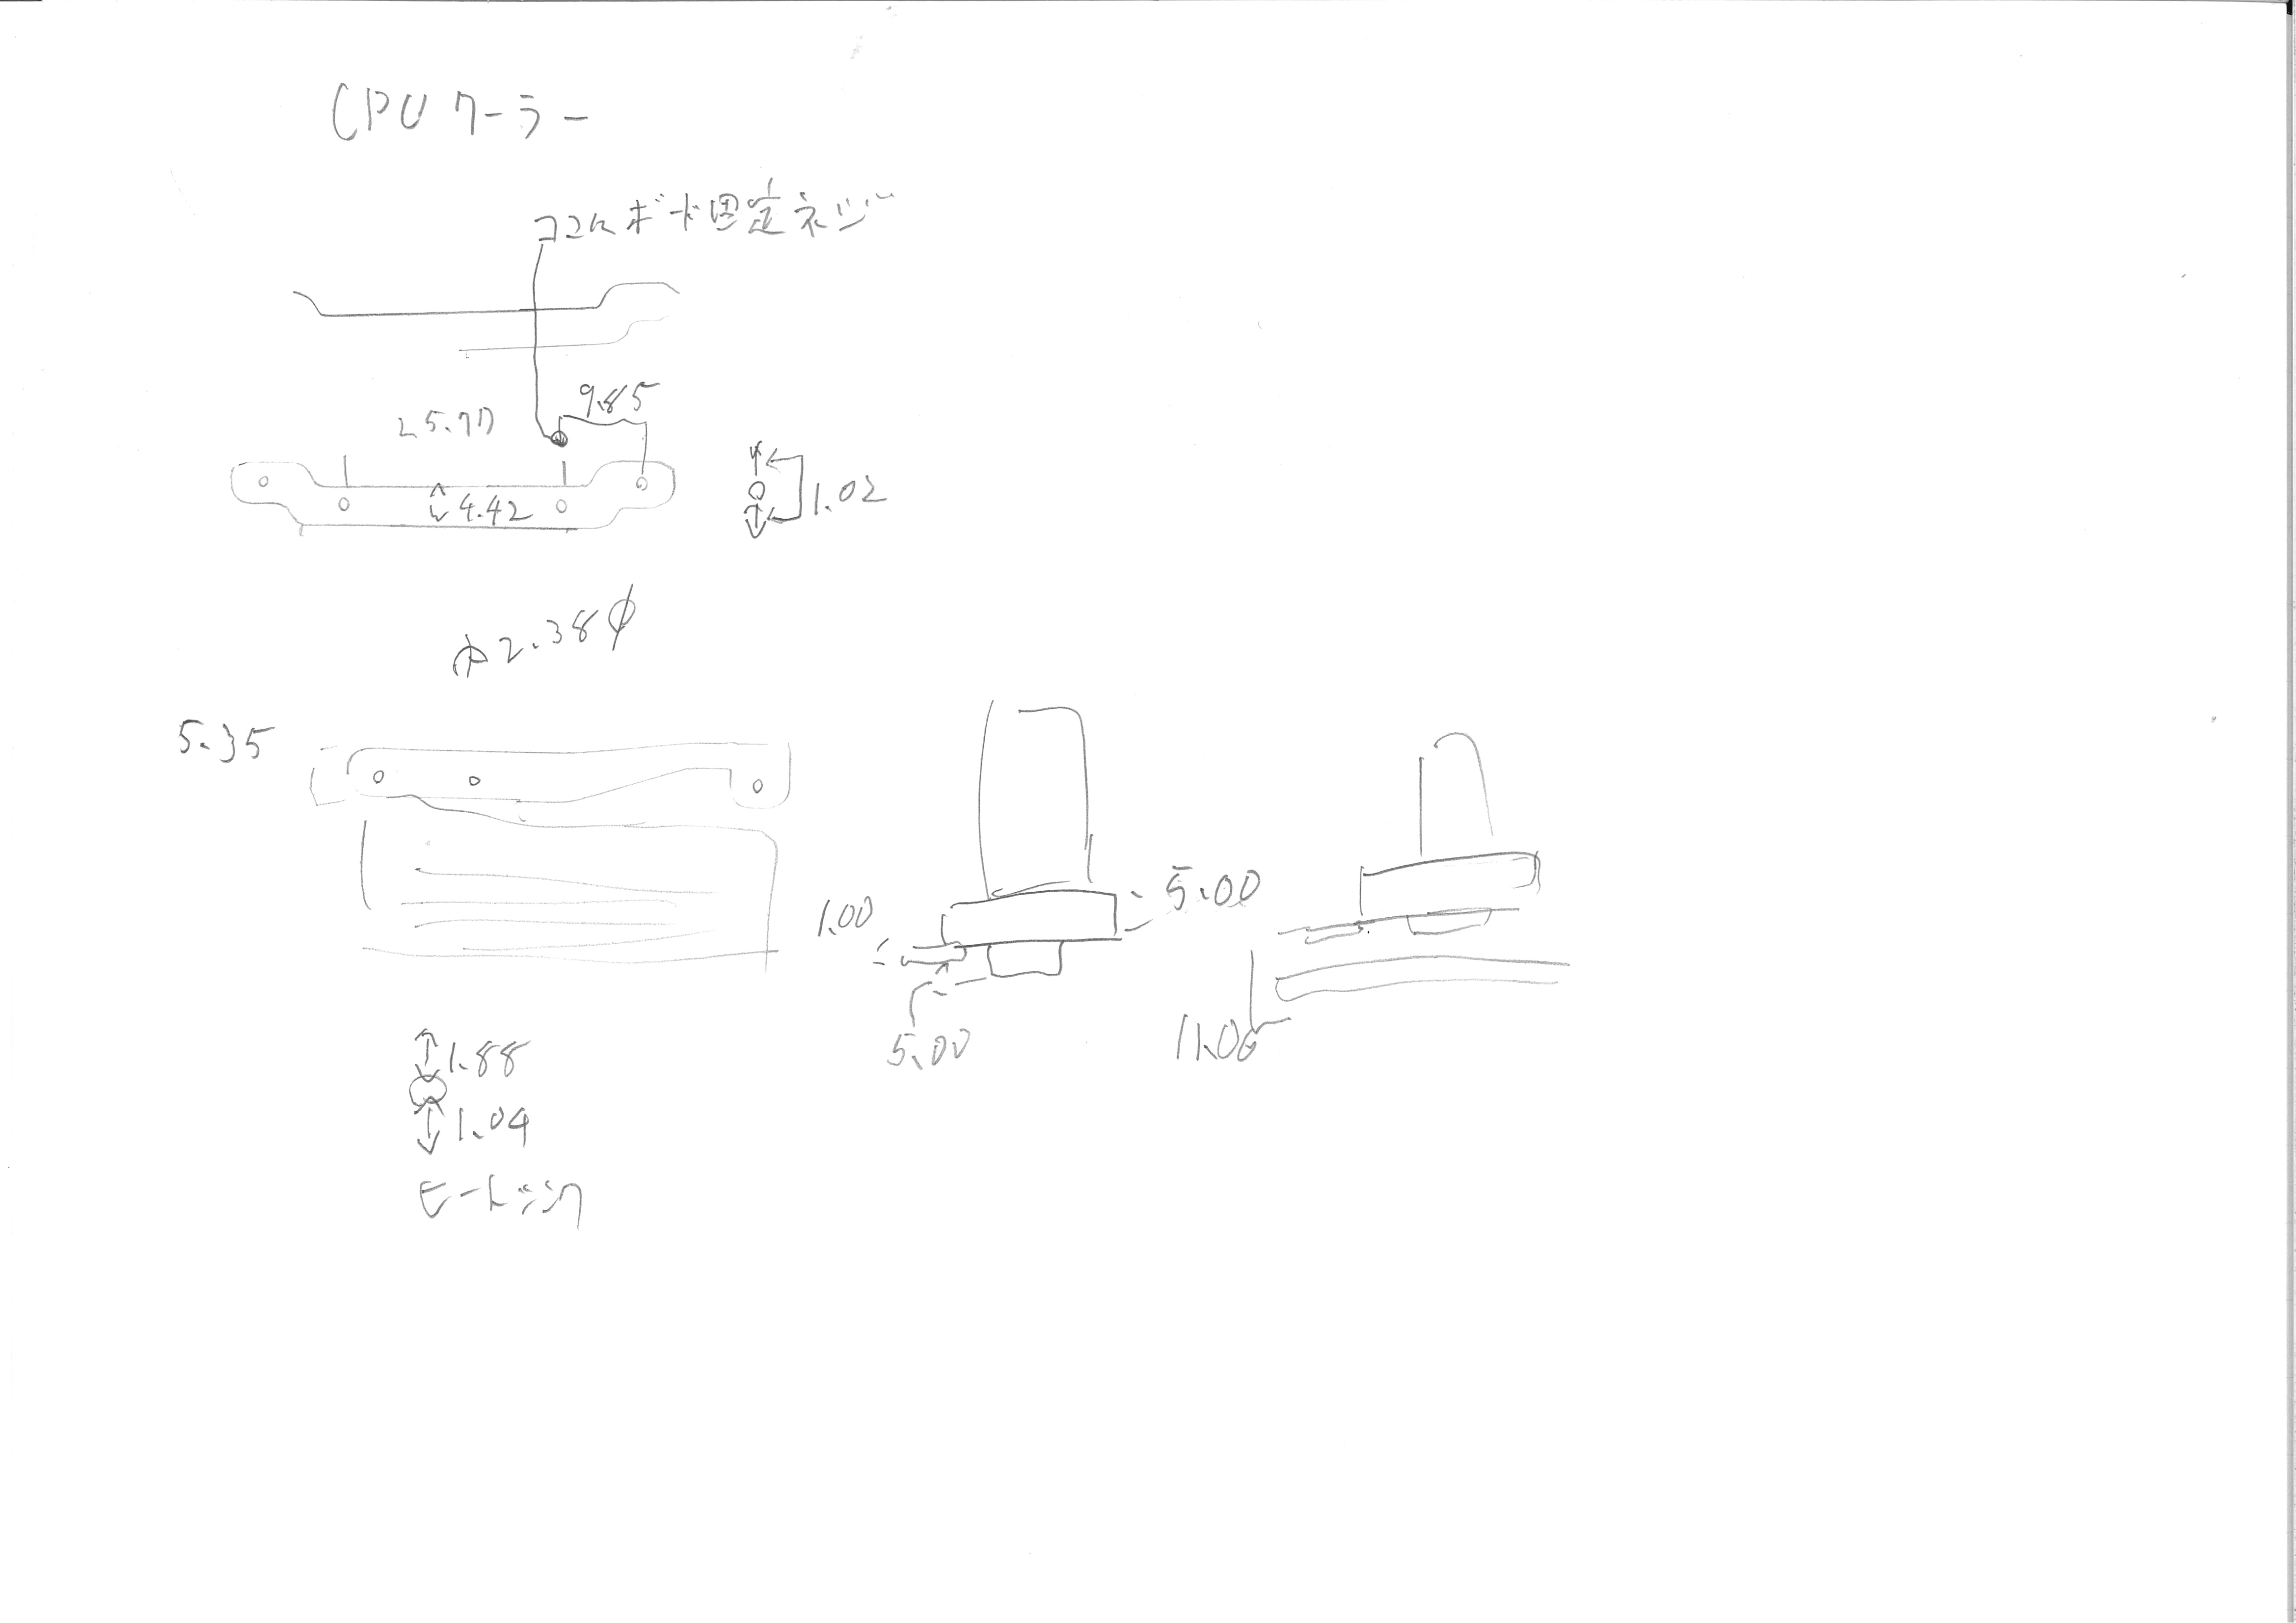
ラズパイクーラーの足回りの寸法

GeeekPi ICE Tower Plus クーラー Raspberry Pi 5、Raspberry Pi 5 4GB/8GB 用冷却ファン付き Pi 5 アルミニウム アクティブクーラーの寸法。

2025/10/14(火)Openwrt本体でメトリクスをグラフで見れるようにした

更新日:
投稿日:

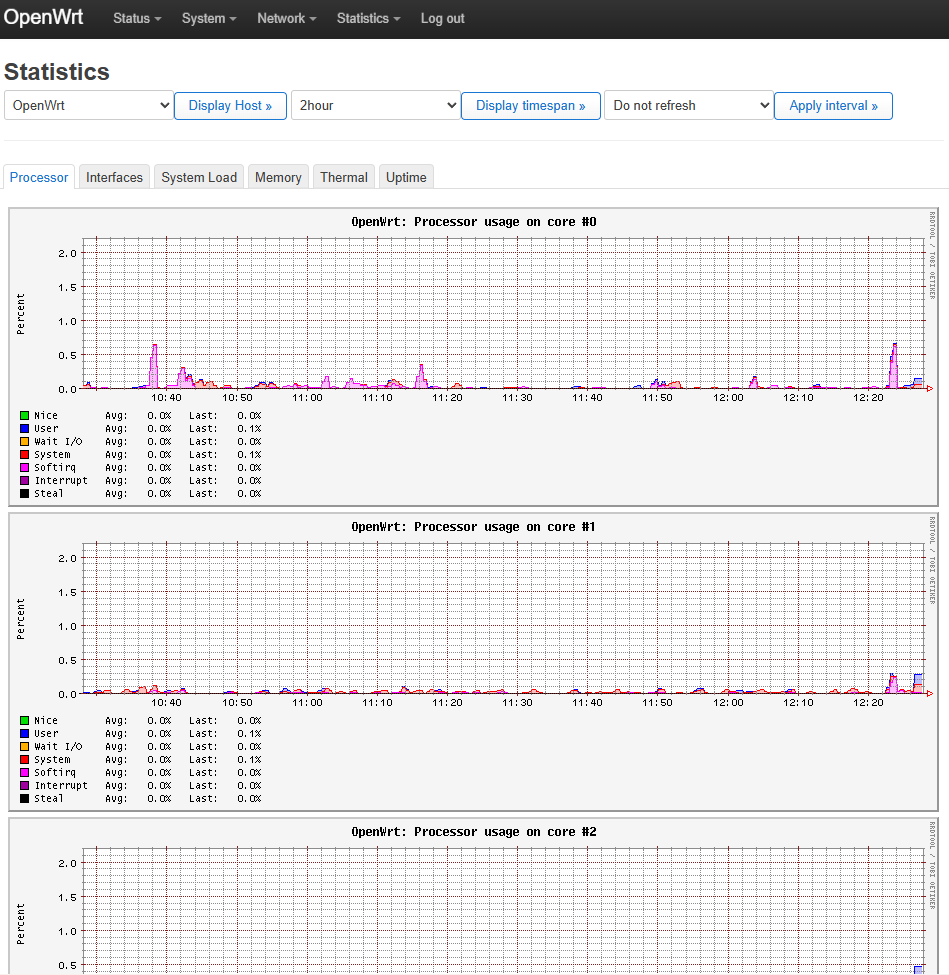
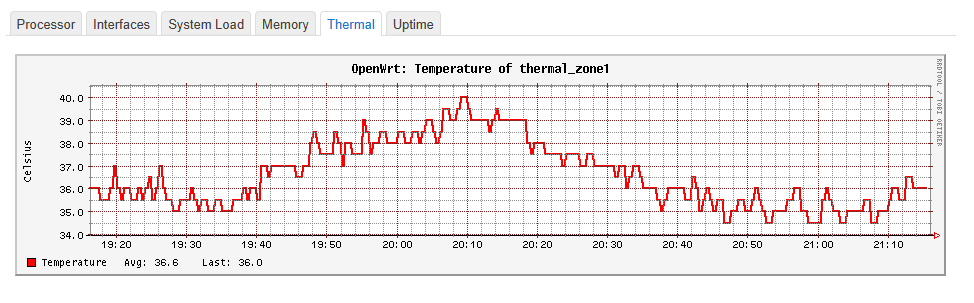
luci-app-statisticsとcollectdを入れて下図のように各メトリクスのグラフを見れるようにした。collectdは、システム情報を定期的に収集し、さまざまな方法で値を格納するメカニズムを提供する小さなデーモンで、luci-app-statisticsはそれをLuCI上に表示するためのものっぽい。

確認環境

Env Ver
OpenWrt 24.10.0

セットアップ

  1. LuCIを開く
  2. System→Software
  3. luci-app-statisticsを入れる
  4. 画面リロード
  5. Statics→Graphからグラフが見れることを確認

この時点で幾つかのプラグインが導入されたが、消したり入れたりして、結果として以下のものを導入した。

Collectdのプラグイン設定

/etc/collectd.confをいじると変更できる。

基本的にはLoadPlugin hogeでhogeプラグインを読み込み、以下の書式で設定するようだ。設定がなければLoadPlugin hogeだけでよい。

<Plugin hoge>
        Foo true
        Bar 1
        Baz "fuga"
</Plugin>

Collectdのプラグイン

collectd-mod-cpu:CPU使用率

collectd-mod-cpu

設定 内容 デフォルト
ValuesPercentage trueであれば、パーセンテージで取れる true
ReportByCpu trueであれば、コアごとに取れる true
ReportByState trueであれば、システム、ユーザー、アイドルなど、状態ごとに取れる true

設定はデフォルトのままで良さそう。

collectd-mod-interface:ネットワーク転送量

collectd-mod-interface

Network→Interfaces→Deviceにあるものが見れる。

br-lanとMAP-E、PPPoEが見たいので以下のようにした。

LoadPlugin interface
<Plugin interface>
        Interface "br-lan"
        Interface "map-wanmap"
        Interface "pppoe-wanppp"
</Plugin>

collectd-mod-load:負荷(Load Average)

uptimeコマンドで出てくる内容と思われる。1を超えていれば過負荷、割っていれば余裕がある。

Wikipediaによると、1ならその時間平均で全てのプロセスが実行され、1.73なら73%のプロセスが実行待ちになったと言う事のようだ。これを1分、5分、15分の平均で出しているとのこと。

設定項目がない。

collectd-mod-memory

メモリの使用量を取れる。

設定 内容 デフォルト
ValuesAbsolute 物理メモリ使用量の絶対数で報告するかどうか(つまりどういうこと?) true
ValuesPercentage メモリ使用量をパーセンテージで報告するかどうか false

設定はデフォルトのままで良さそう。

collectd-mod-thermal

デバイスの温度を取れる。

設定 内容 デフォルト
ForceUseProcfs Linuxインターフェースではなく、procfsから熱源を取得する false
Device 温度を取得するデバイス名
IgnoreSelected trueにするとDeviceで指定したデバイスを集計外にする false

R86S U1の場合、thermal_zone1以外無価値に見えたので、thermal_zone1のみとした。thermal_zone0はマザーボードの温度のようだが、固定値しか出てこない。

LoadPlugin thermal
<Plugin thermal>
        Device "thermal_zone1"
</Plugin>

これだけだと余計なグラフが出てくるため、設定後に余計なグラフデータを削除する。

collectd-mod-uptime

公式にマニュアルはなさそうだが、起動時間を見れる。

LoadPlugin uptime

collectd-mod-rrdtool

collectdが取得したメトリクスを保存したり、メトリクスのグラフを書くのに使われている模様。特に設定せずとも勝手に設定されるため設定を気にする必要性はなさそう。

ログは標準では/tmp/rrd/OpenWrt/に保存されているようなのでストレージの摩耗は気にしなくていい。(/tmp/はオンメモリストレージ)

トラブルシューティング

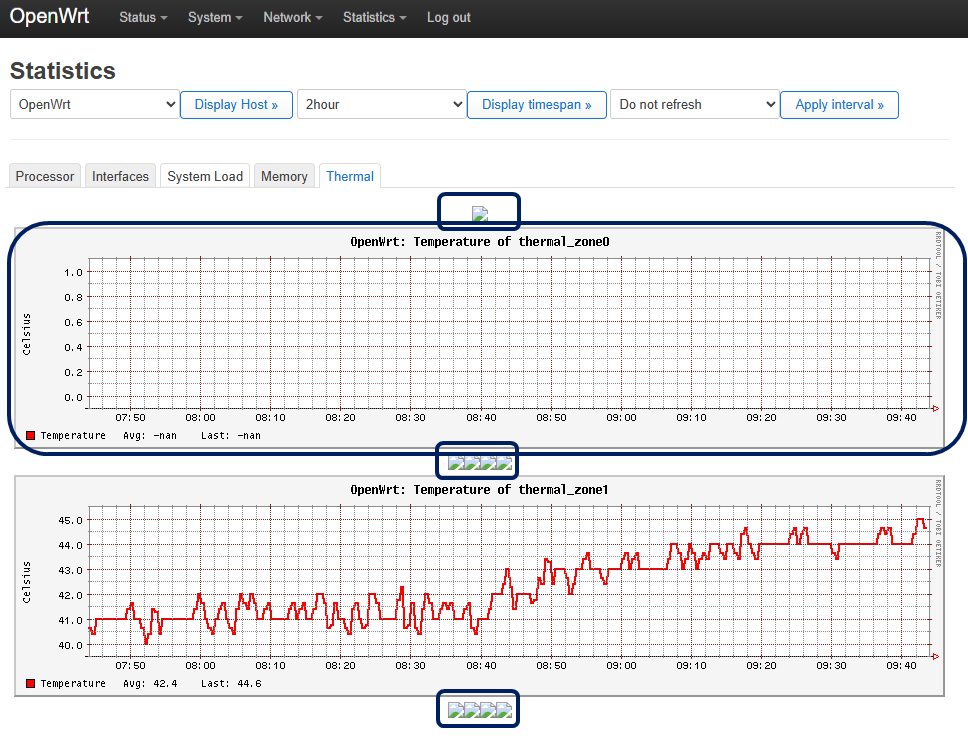
Thermalタブに壊れて表示されていない画像や、集計対象外のグラフが表示される

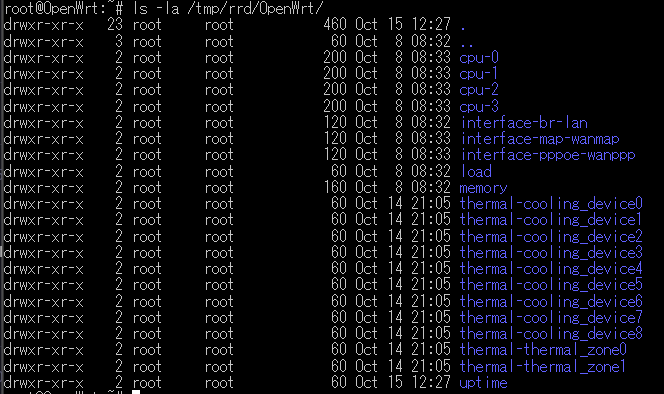
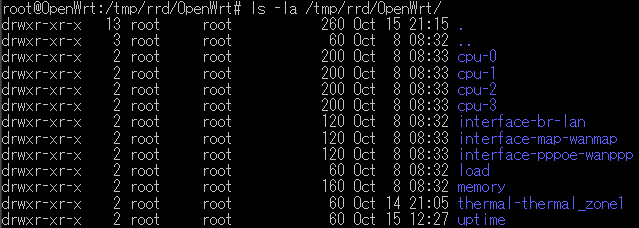
上図の青枠のように壊れて表示されていない画像や、集計対象外のものが表示されている場合、/tmp/rrd/OpenWrt/配下にある不要なメトリクスを削除することで非表示にできる。

例えば上図にあるthermal-cooling_device*にはまともにデータが入っていないため、画像が壊れて表示されている。rm -Rf thermal-cooling_device*で消すと出てこなくなる。

上図の状態になると、下図のように不要なグラフが表示されなくなる。

但しcollectd.confで以下のようにデバイスを絞っていないと、再び出てくると思われるので、設定で表示したいものだけに絞ってから消した方がよい。

LoadPlugin thermal
<Plugin thermal>
        Device "thermal_zone1"
</Plugin>

参考