2023/08/13(日)Windows 11が0xc000000eで起動しなくなったのを直した
更新日:
投稿日:
投稿日:
ブートドライブをクローンしてクローン元を削除したら起動しなくなったので、その時にやったことのメモ
前提条件
- OSがWindows 11
- Windows 10のインストールUSBがある
事前手順
- SSD1からSSD2へブートディスクをクローン
- OSをシャットダウン
- UEFIを起動し、SSD2を指定してブート
- コンピューターの管理からSSD1のボリュームを消す
- EFIシステムだけは消えなかったのでdiskpartを使う方法で削除した
- OSをシャットダウン
- 電源を入れる
- ブルースクリーンになり0xc000000eエラーが発生
解決方法
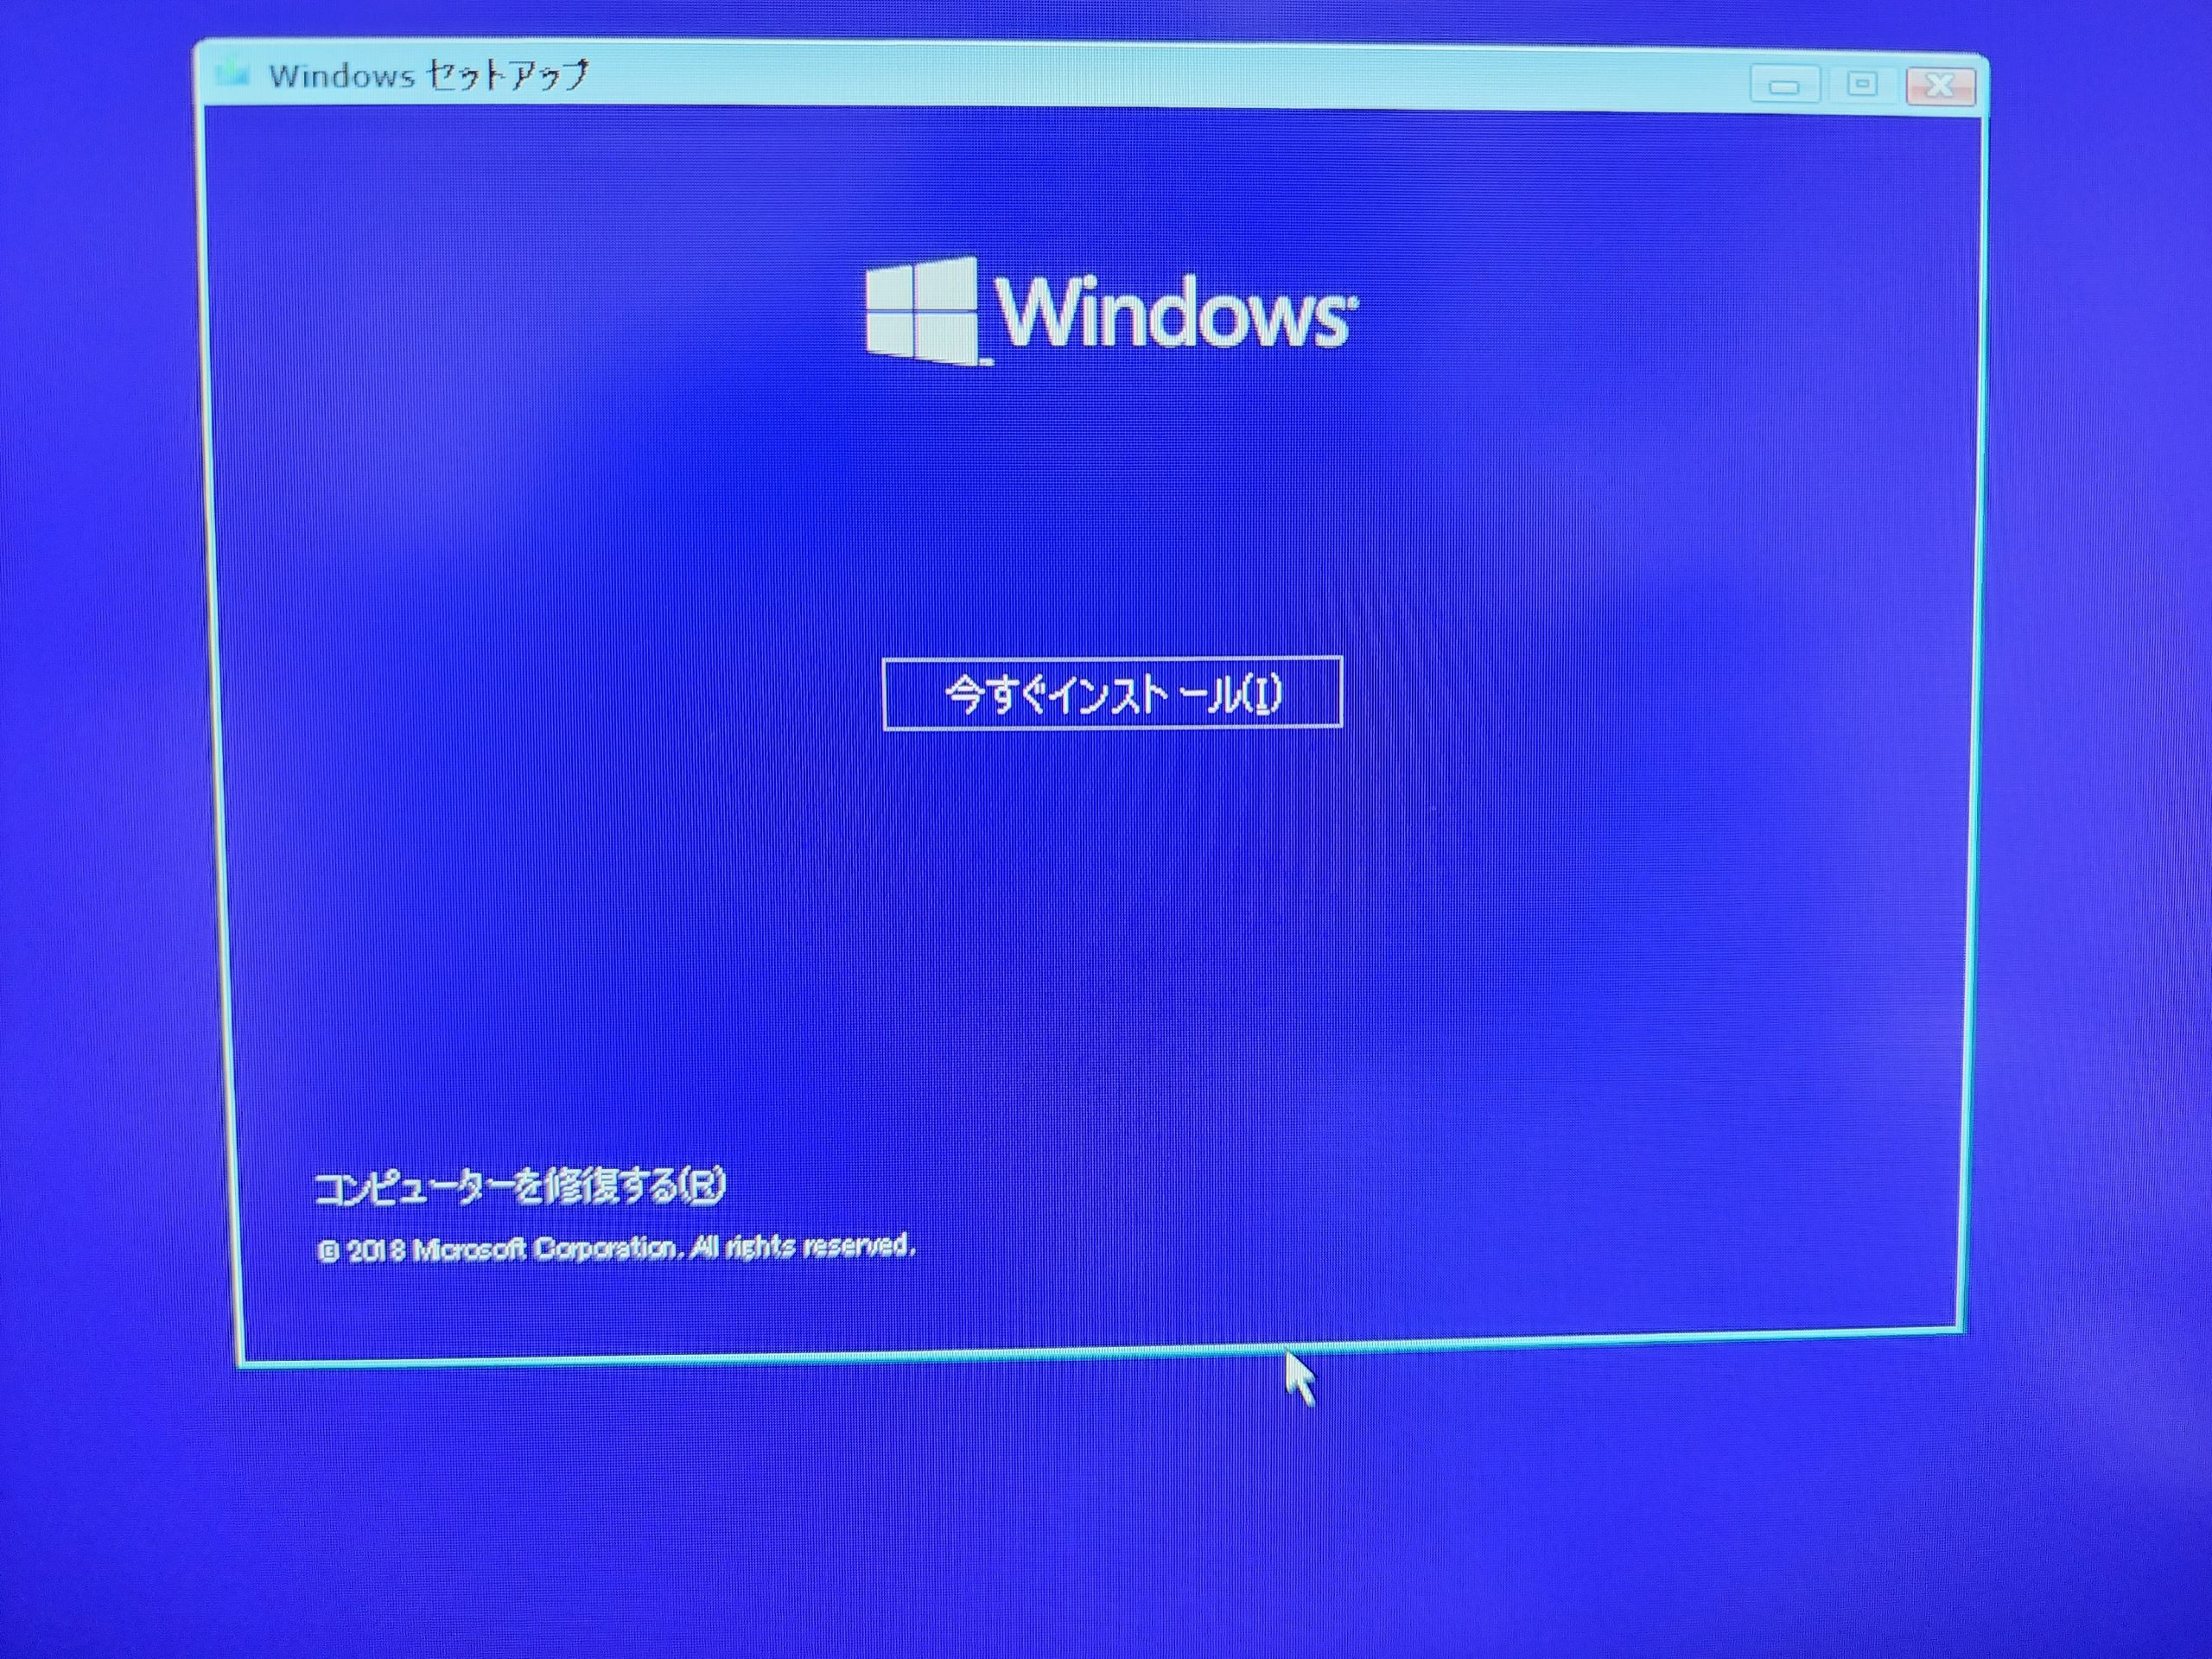
Windows 10のインストールUSBを持っていたので、これを使ってリカバリを試みた。
リカバリ用コマンドプロンプトの起動
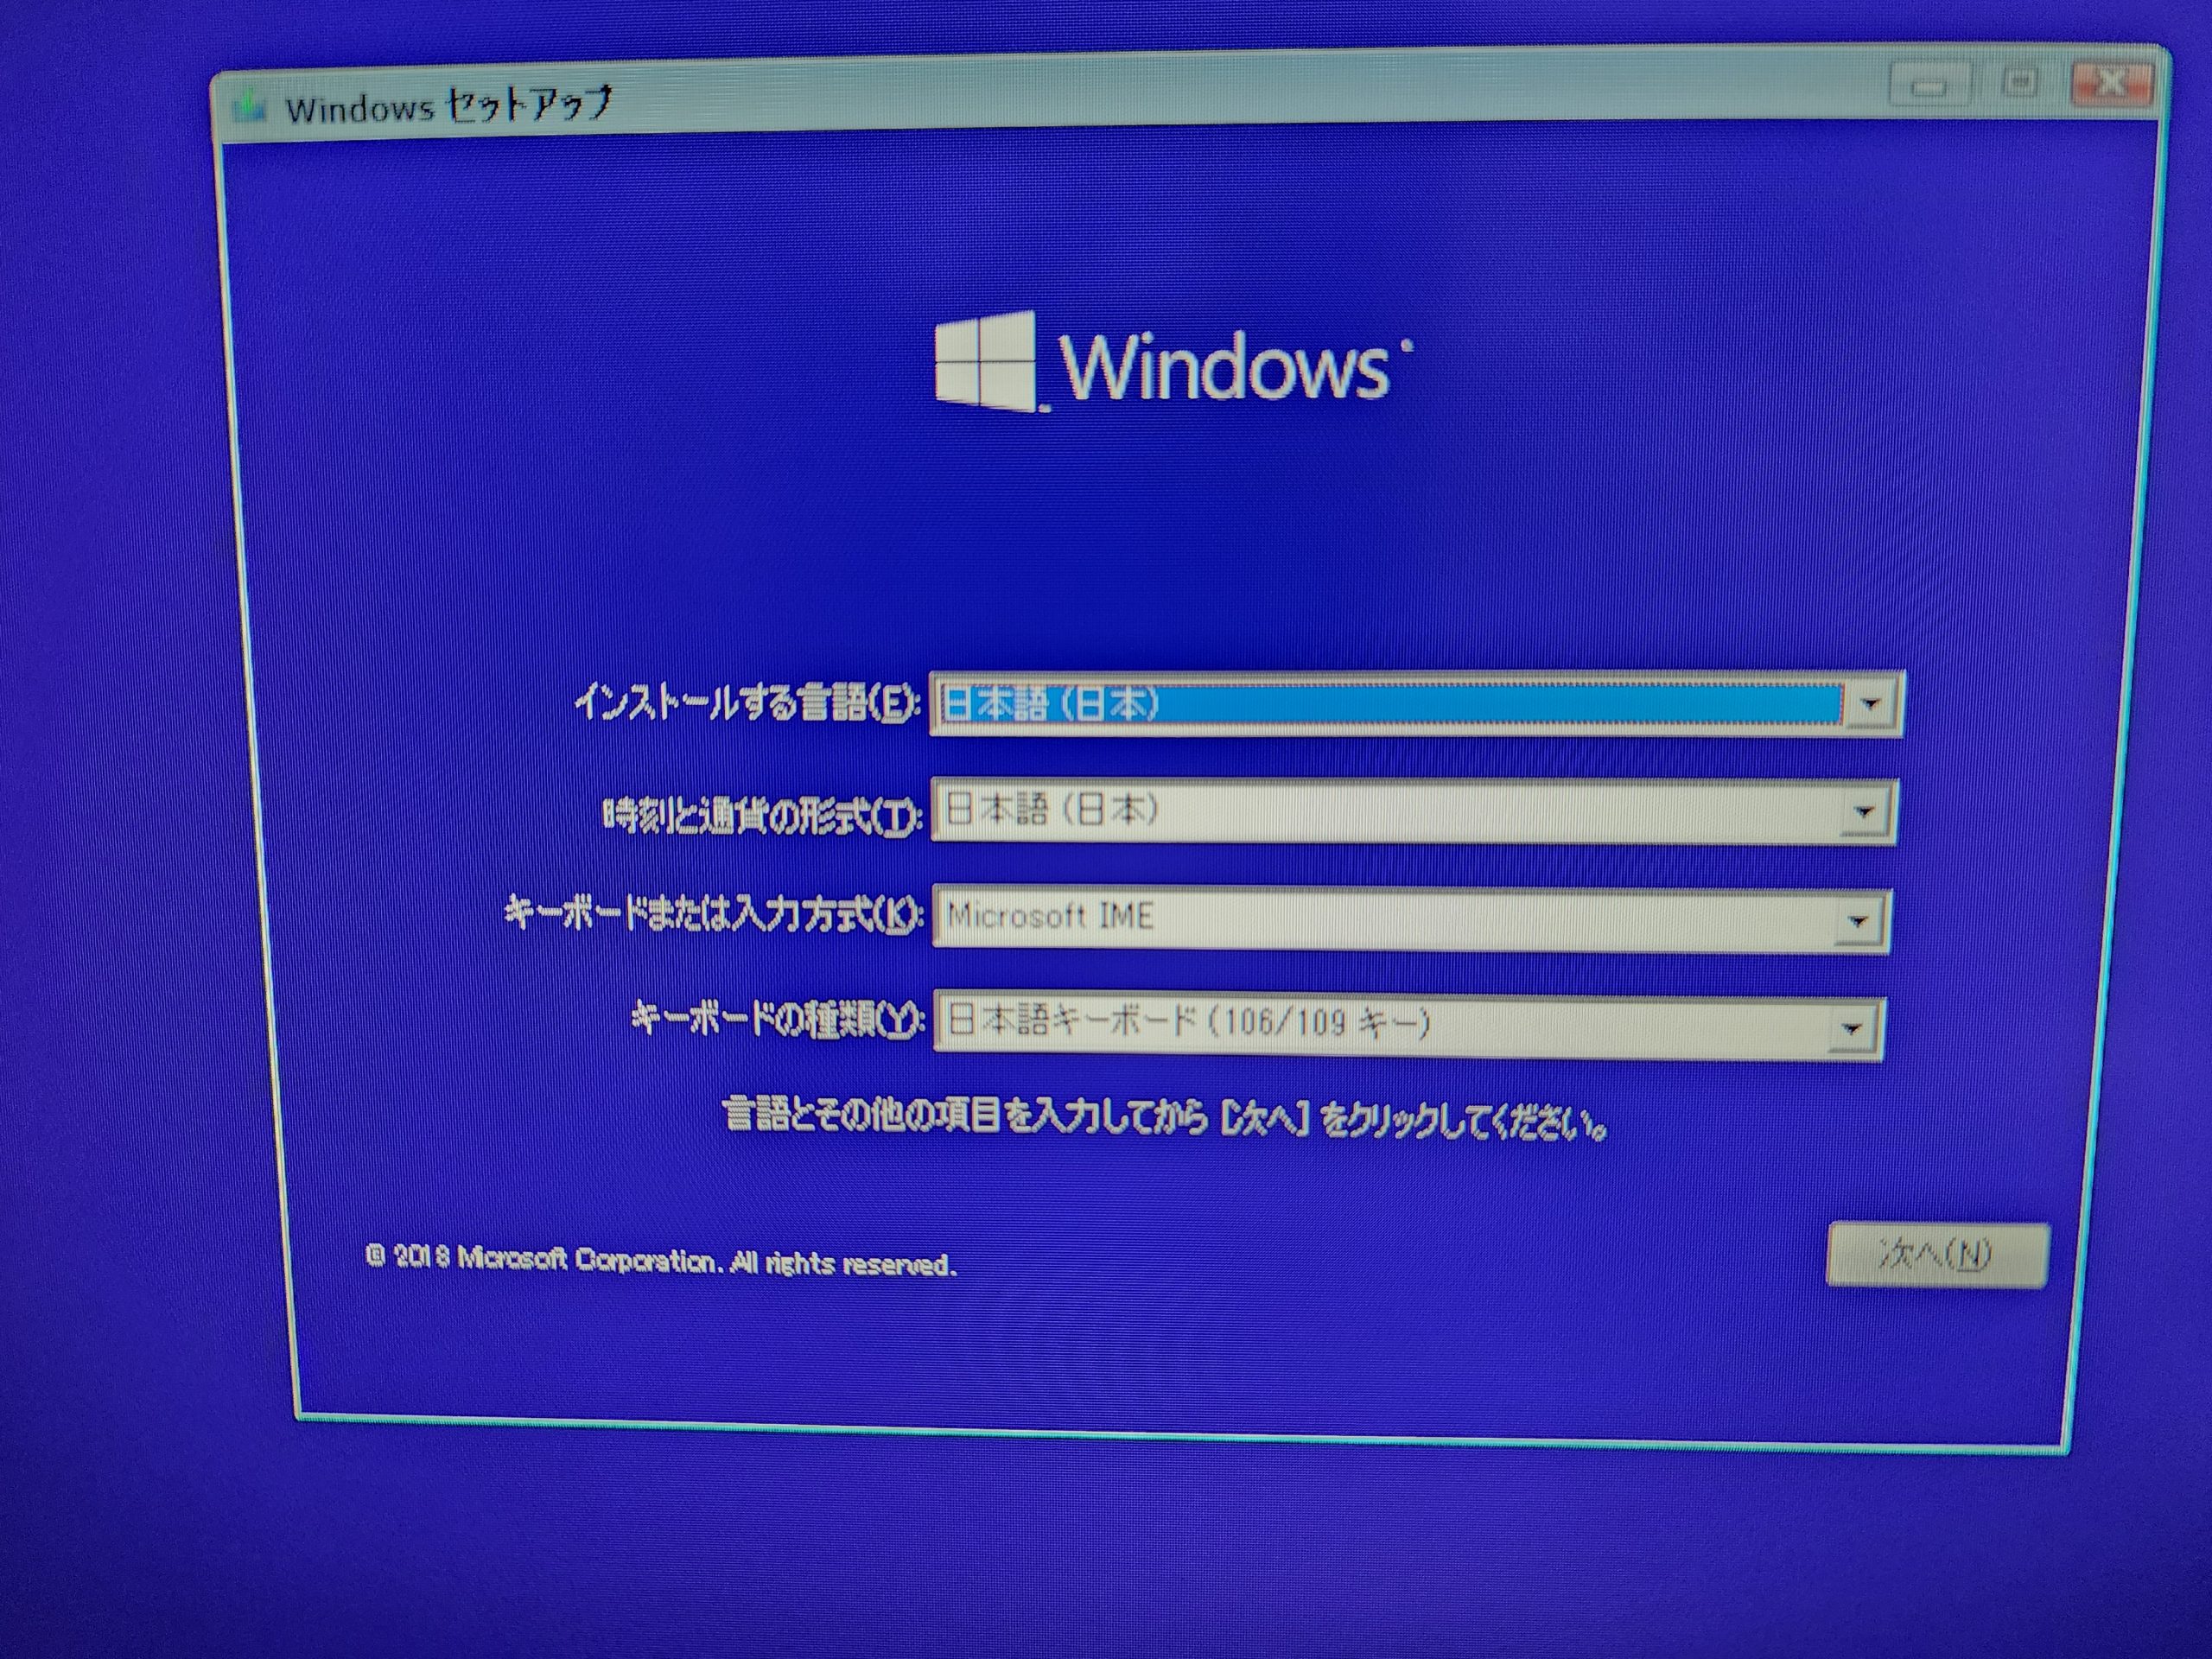
- Windows 10のインストールUSBを挿入しUEFIからインストールモードで起動
- 言語選択画面をそのままパスする
- 「コンピューターを修復する」を選択
- トラブルシューティング→コマンドプロンプト
ブート情報の修復
UEFI/GPTインストールしたWindowsの「ブート領域」の復旧方法を参考にやっているのだが、途中でbootrec /fixbootが「アクセスが拒否されました」と言ってコケて中断してしまったため、この作業に意味があったのかどうかよくわかっていない。
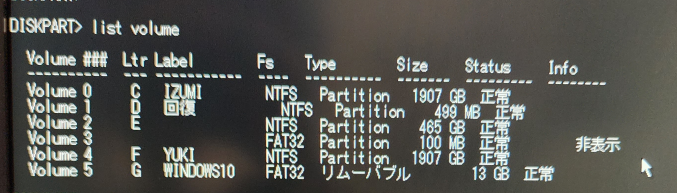
diskpartを流すlist volumeで今回作成したブートボリュームとEFIシステムボリュームを特定する。この場合はVolume 2と3。select volume 3でEFIシステムボリュームを選択assign letter=b:でドライブレターを割り当てる。因みにこのドライブレターは再起動で消える。exitcd /d b:\EFI\WMicrosoft\bootするren BCD BCD.bakbootrec /Rebuildbcdbootrec /fixboot- 「アクセスが拒否されました」と言ってコケた
ドライブレターの修正
bootrec /fixbootがコケた時にドライブレターのせいじゃね?と思って試してみたやつ
diskpartを流す- Cドライブにデータドライブが入っていたので適当にドライブレターを変える
select volume 0assign letter=H:
- Eドライブにブートドライブが入っていたのでCに変える
select volume 2assign letter=C:
exitで抜ける- リカバリメニューに戻るので「PCの電源を切る」を選択
この後PCを通常起動したら起動するようになったので解決。起動後にHドライブはなかったので結局どれが決定打だったのかよくわかっていない。なおHドライブはEドライブ扱いになっていた。取り敢えず起動するようになったのでいっか。
この後、もう一度リカバリモードに入り、前述のブート情報の修復の手順で作成したBCD.bakを削除した。
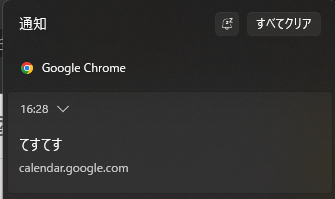
2023/06/08(木)Windows 10, 11で通知バナーが表示されない問題の解消法
更新日:
投稿日:
投稿日:
2023/05/24(水)Jestのメモリリークを解消する
更新日:
投稿日:
投稿日:
TypeScript + SWCと組み合わせてJestを回してるとテストケースの増加に伴いメモリリークが発生する現象が起きます。メモリに余裕があれば問題にはならないですが、開発機のメモリが足りないとかCIで使ってるECSのメモリが足りないとか、引っかかるケースもあると思います。
今回はこの問題に対する対処法を書いていきます。完全には改善されませんが、かなりマシになります。参考までに今回の検証では283MB使ってたのが67MBまで減りました。
この現象はNode.js 16.11.0以降で発生するらしいので、それ以前の環境では起きないかもしれません。
確認環境
Node.js v20.0.0
| module | version |
|---|---|
| @swc/cli | 0.1.62 |
| @swc/core | 1.3.59 |
| @swc/jest | 0.2.26 |
| @types/jest | 29.5.1 |
| @types/node | 20.2.3 |
| jest | 29.5.0 |
| jest-watch-typeahead | 2.2.2 |
| typescript | 5.0.4 |
確認用のテストコード
以下のテストコードを書いたファイルを100ファイル作り、それを流して確認しています。
describe('example1', () => {
  it('1', () => {
    expect(1).toBe(1);
  });
  it('2', () => {
    expect(2).toBe(2);
  });
  it('3', () => {
    expect(3).toBe(3);
  });
  it('4', () => {
    expect(4).toBe(4);
  });
  it('5', () => {
    expect(5).toBe(5);
  });
});

describe('example2', () => {
  it('1', () => {
    expect(1).toBe(1);
  });
  it('2', () => {
    expect(2).toBe(2);
  });
  it('3', () => {
    expect(3).toBe(3);
  });
  it('4', () => {
    expect(4).toBe(4);
  });
  it('5', () => {
    expect(5).toBe(5);
  });
});
確認環境一式
以下のリポジトリに確認したソースコードを一式格納しています。
[blogcard https://github.com/Lycolia/jest-memory-leak-example]
メモリリークしていく様子
(41 MB heap size)
(42 MB heap size)
(52 MB heap size)
(51 MB heap size)
(37 MB heap size)
(47 MB heap size)
(47 MB heap size)
(50 MB heap size)
(60 MB heap size)
(60 MB heap size)
(62 MB heap size)
(71 MB heap size)
(73 MB heap size)
(74 MB heap size)
(84 MB heap size)
(85 MB heap size)
(86 MB heap size)
(96 MB heap size)
(97 MB heap size)
(99 MB heap size)
(108 MB heap size)
(110 MB heap size)
(111 MB heap size)
(120 MB heap size)
(122 MB heap size)
(124 MB heap size)
(75 MB heap size)
(83 MB heap size)
(84 MB heap size)
(86 MB heap size)
(96 MB heap size)
(96 MB heap size)
(97 MB heap size)
(107 MB heap size)
(108 MB heap size)
(109 MB heap size)
(118 MB heap size)
(120 MB heap size)
(121 MB heap size)
(130 MB heap size)
(132 MB heap size)
(133 MB heap size)
(143 MB heap size)
(144 MB heap size)
(145 MB heap size)
(154 MB heap size)
(156 MB heap size)
(157 MB heap size)
(166 MB heap size)
(168 MB heap size)
(169 MB heap size)
(179 MB heap size)
(181 MB heap size)
(182 MB heap size)
(191 MB heap size)
(193 MB heap size)
(194 MB heap size)
(203 MB heap size)
(205 MB heap size)
(207 MB heap size)
(216 MB heap size)
(217 MB heap size)
(219 MB heap size)
(228 MB heap size)
(230 MB heap size)
(231 MB heap size)
(240 MB heap size)
(242 MB heap size)
(243 MB heap size)
(252 MB heap size)
(254 MB heap size)
(255 MB heap size)
(264 MB heap size)
(266 MB heap size)
(267 MB heap size)
(277 MB heap size)
(278 MB heap size)
(280 MB heap size)
(195 MB heap size)
(204 MB heap size)
(203 MB heap size)
(212 MB heap size)
(213 MB heap size)
(214 MB heap size)
(223 MB heap size)
(224 MB heap size)
(226 MB heap size)
(235 MB heap size)
(237 MB heap size)
(238 MB heap size)
(247 MB heap size)
(249 MB heap size)
(250 MB heap size)
(259 MB heap size)
(261 MB heap size)
(262 MB heap size)
(271 MB heap size)
(273 MB heap size)
(274 MB heap size)
(283 MB heap size)

Test Suites: 100 passed, 100 total
Tests:       1000 passed, 1000 total
Snapshots:   0 total
Time:        11.347 s, estimated 12 s
解消方法
npm i -D @side/jest-runtime などで@side/jest-runtimeを導入し、jest.config.jsに以下の行を追加することで改善します。
runtime: '@side/jest-runtime',
このコードで何か既存の実装やテストに影響が発生するかどうかは確認していませんが、後述する@side/jest-runtimeが生まれる切欠になったPRの様子を見る限り大丈夫なんじゃないかなとなんとなく思っています。
メモリリークが改善したあとの様子
(39 MB heap size)
(39 MB heap size)
(47 MB heap size)
(47 MB heap size)
(34 MB heap size)
(42 MB heap size)
(41 MB heap size)
(49 MB heap size)
(51 MB heap size)
(59 MB heap size)
(59 MB heap size)
(60 MB heap size)
(68 MB heap size)
(69 MB heap size)
(77 MB heap size)
(77 MB heap size)
(85 MB heap size)
(86 MB heap size)
(95 MB heap size)
(95 MB heap size)
(95 MB heap size)
(103 MB heap size)
(104 MB heap size)
(112 MB heap size)
(112 MB heap size)
(120 MB heap size)
(121 MB heap size)
(31 MB heap size)
(38 MB heap size)
(37 MB heap size)
(44 MB heap size)
(46 MB heap size)
(54 MB heap size)
(54 MB heap size)
(54 MB heap size)
(62 MB heap size)
(62 MB heap size)
(70 MB heap size)
(71 MB heap size)
(79 MB heap size)
(79 MB heap size)
(87 MB heap size)
(88 MB heap size)
(96 MB heap size)
(96 MB heap size)
(97 MB heap size)
(105 MB heap size)
(105 MB heap size)
(31 MB heap size)
(39 MB heap size)
(37 MB heap size)
(44 MB heap size)
(46 MB heap size)
(54 MB heap size)
(54 MB heap size)
(54 MB heap size)
(62 MB heap size)
(62 MB heap size)
(70 MB heap size)
(70 MB heap size)
(78 MB heap size)
(79 MB heap size)
(87 MB heap size)
(88 MB heap size)
(96 MB heap size)
(96 MB heap size)
(96 MB heap size)
(104 MB heap size)
(105 MB heap size)
(31 MB heap size)
(39 MB heap size)
(37 MB heap size)
(45 MB heap size)
(46 MB heap size)
(54 MB heap size)
(54 MB heap size)
(54 MB heap size)
(62 MB heap size)
(63 MB heap size)
(70 MB heap size)
(71 MB heap size)
(78 MB heap size)
(79 MB heap size)
(87 MB heap size)
(88 MB heap size)
(96 MB heap size)
(96 MB heap size)
(97 MB heap size)
(105 MB heap size)
(105 MB heap size)
(30 MB heap size)
(37 MB heap size)
(45 MB heap size)
(43 MB heap size)
(44 MB heap size)
(51 MB heap size)
(51 MB heap size)
(59 MB heap size)
(59 MB heap size)
(67 MB heap size)

Test Suites: 100 passed, 100 total
Tests:       1000 passed, 1000 total
Snapshots:   0 total
Time:        9.071 s, estimated 11 s
参考記事
メモリリークバグに関するIssue
https://github.com/jestjs/jest/issues/11956
@side/jest-runtimeが出来る元になったPR
https://github.com/jestjs/jest/pull/12205
2023/05/23(火)ASUS TUF GAMING Z790-PLUS D4トラブルシューティングメモ
更新日:
投稿日:
投稿日:
ASUS TUF GAMING Z790-PLUS D4を導入した際に起きたトラブルの解消法メモ
インターネットに繋がらない
- デバイスマネージャーを開く
- 不明なデバイス(ネットワークアダプタ)を探す
- ASUSのドライバディスクを指定してドライバをインストールする
ASUSのインストールユーティリティを使っても上手く入らない
スリープ状態から勝手に復帰する
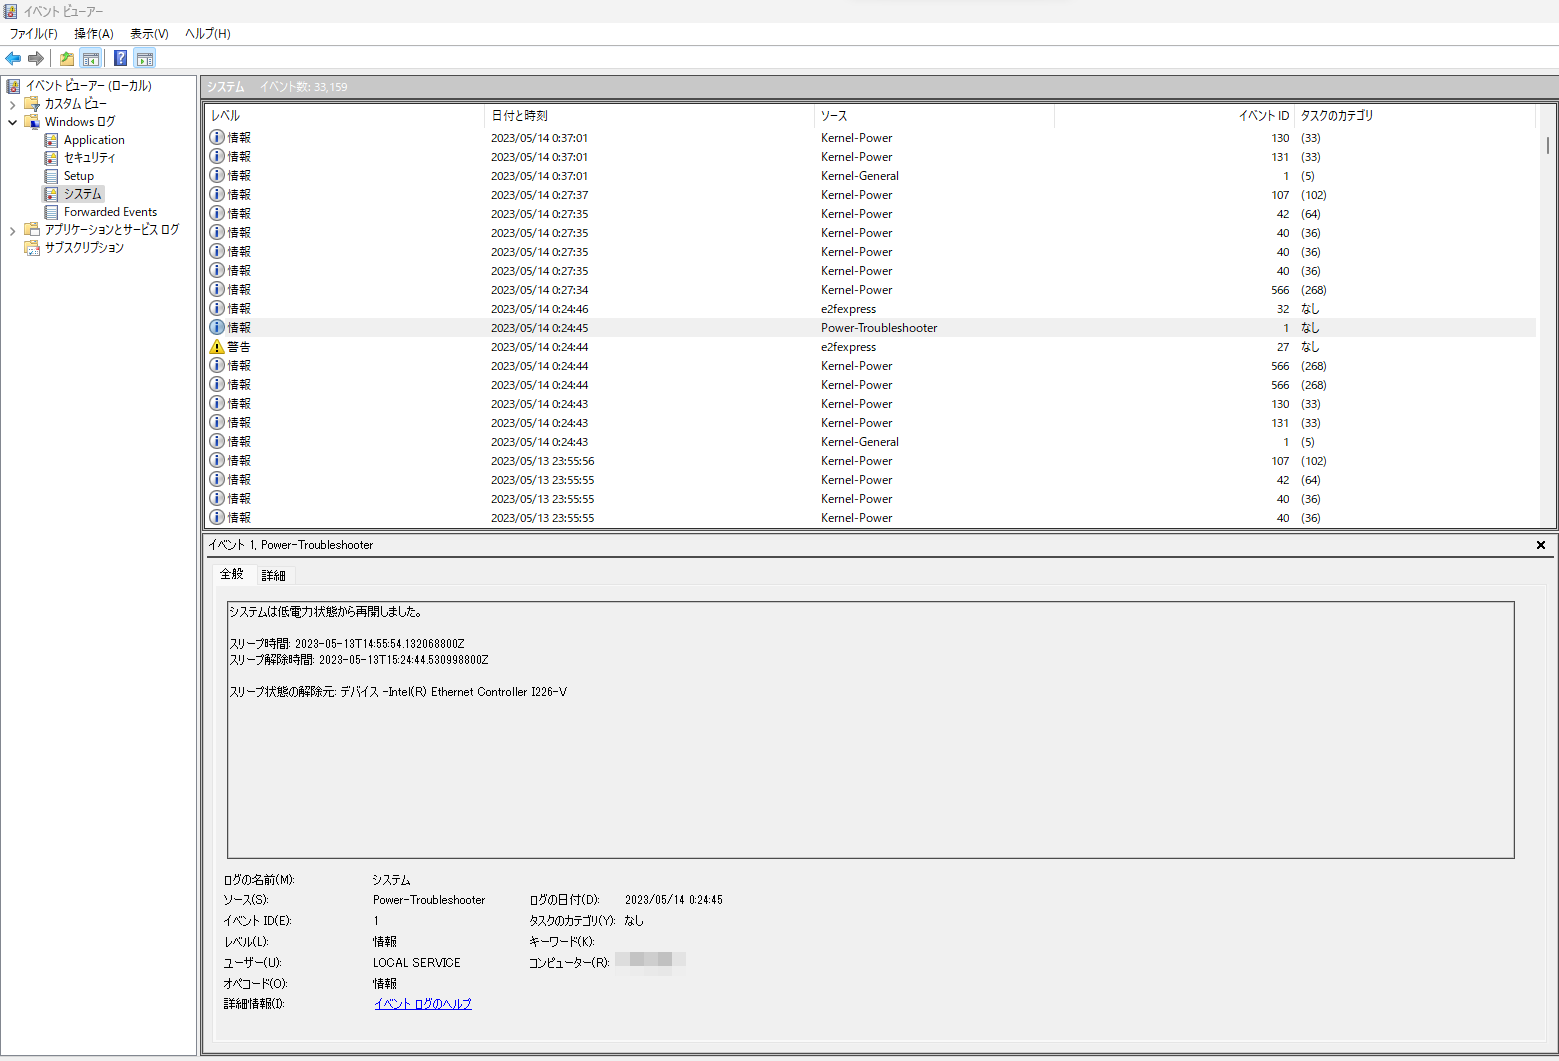
原因確認
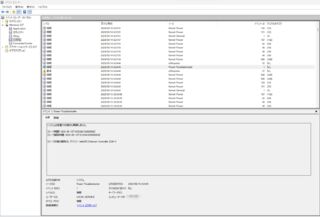
- イベントビューワを開く
- Windowsログ>システムを開き、ソースが
Power-Troubleshooterとなっているものを探す スリープ状態の解除元: デバイス -Intel(R) Ethernet Controller I226-Vとなっていたら解消法の内容で解消できる
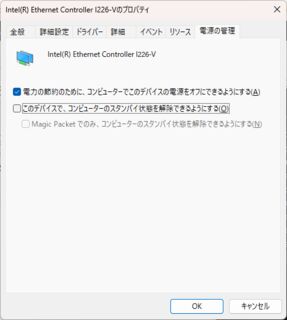
解消法
- デバイスマネージャーを開く
- ネットワークアダプタ>Intel(R) Ethernet Controller I226-V
このデバイスでコンピューターのスタンバイ状態を解除できるようにするのチェックを外す

ネットワーク速度が極端に遅くなったり、接続が不安定になる
発生した症状
他の端末では起きないことは確認
- fast.comのスコアで450Mbpsが20~200Mbpsまで低下
- 回線速度が乱高下を繰り返し安定しない
- 頻繁にネットワークが切断される
解消法
- デバイスマネージャーを開く
- ネットワークアダプタ>Intel(R) Ethernet Controller I226-V
速度とデュプレックスを2.5Gbps 全二重通信に変更(既定値はオートネゴシエーション)省電力イーサーネットをオフに変更(既定値はオン (システムが S0、S0ix、Sx 状態の場合))- Windowsを再起動
- fast.comで速度が正常化していることを確認


参考情報
https://www.null3-blog.com/entry/I226-V_fix
https://bbs.kakaku.com/bbs/K0001481981/SortID=25111393/#tab
2023/04/17(月)Windows 11でエクスプローラーが重いのを解消する
更新日:
投稿日:
投稿日:
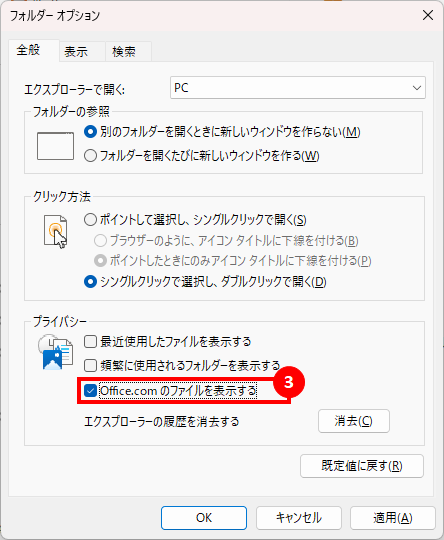
最近重くなった人向け。フォルダーオプションを開いて、Office.comのファイルを表示するのチェックを外せば解消すると思います。多分
解消手順
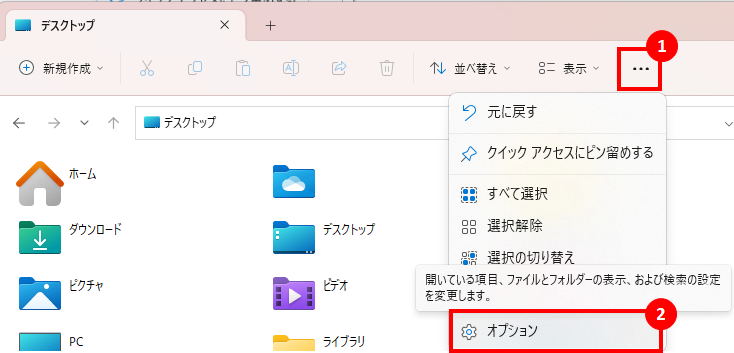
- フォルダーオプションを開く

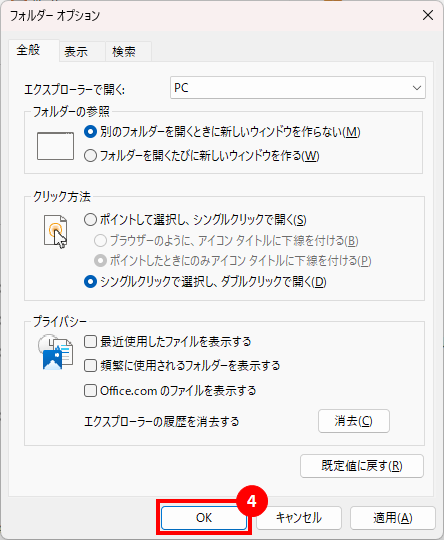
- Office.comのファイルを表示するのチェックを外す
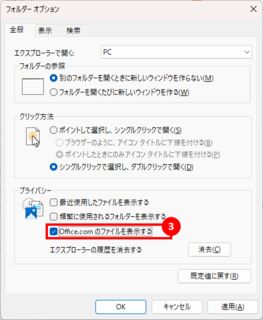
- OKを押す